OPEN-SOURCE SCRIPT
Market Structure Dashboard @darshakssc
📌 Market Structure Dashboard by darshakssc is a comprehensive visual analysis tool designed to assist traders and analysts in understanding market conditions by presenting multiple key technical insights in one place.
This script does not provide buy or sell signals, but helps you interpret essential elements of market behavior — such as structure shifts, momentum conditions, trend direction, and volatility — for informed decision-making.
🔍 What This Dashboard Displays:
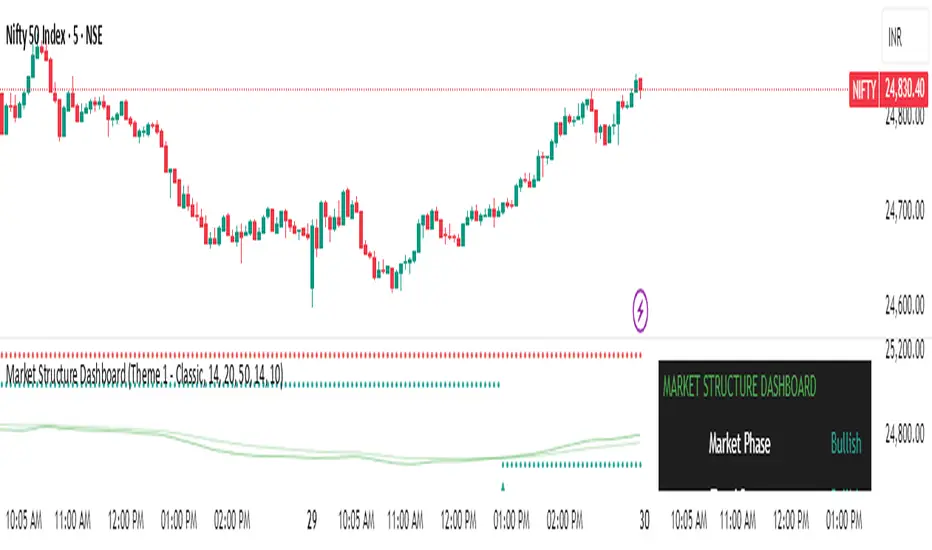
✅ Market Phase Detection
Identifies the current market condition as Bullish, Bearish, Accumulation, or Distribution, based on trend logic and RSI thresholds.
✅ Trend Direction (EMA-Based)
Uses customizable Fast and Slow Exponential Moving Averages (EMAs) to evaluate whether the market is trending upward or downward.
✅ Key Support & Resistance Levels
Highlights potential support and resistance areas based on structural highs and lows and pivot logic.
✅ RSI Momentum State
Tracks whether momentum is Overbought, Oversold, or Neutral, using the classic RSI indicator.
✅ Volatility Overview
Detects high or low volatility zones using ATR (Average True Range) compared to a moving average baseline.
✅ Structure Shift Markers
Displays triangle markers on the chart when a structural trend shift is detected.
✅ Custom Themes and Design
Choose between three clean themes — Classic, Modern, and Dark — for enhanced readability and aesthetics.
📊 Visual Elements
1). An intuitive table-style dashboard appears in the top-right of the chart.
2). Colored EMA overlays and plotted support/resistance circles on the price chart.
3). Structure shift indicators help visually mark potential change zones.
⚠️ Important Notice:
This tool is intended for educational and informational purposes only. It does not provide financial advice, trade recommendations, or guaranteed outcomes. Always use your own discretion and analysis, and consult a qualified financial professional before making investment decisions.
Trading involves risk and past performance does not guarantee future results.
This script does not provide buy or sell signals, but helps you interpret essential elements of market behavior — such as structure shifts, momentum conditions, trend direction, and volatility — for informed decision-making.
🔍 What This Dashboard Displays:
✅ Market Phase Detection
Identifies the current market condition as Bullish, Bearish, Accumulation, or Distribution, based on trend logic and RSI thresholds.
✅ Trend Direction (EMA-Based)
Uses customizable Fast and Slow Exponential Moving Averages (EMAs) to evaluate whether the market is trending upward or downward.
✅ Key Support & Resistance Levels
Highlights potential support and resistance areas based on structural highs and lows and pivot logic.
✅ RSI Momentum State
Tracks whether momentum is Overbought, Oversold, or Neutral, using the classic RSI indicator.
✅ Volatility Overview
Detects high or low volatility zones using ATR (Average True Range) compared to a moving average baseline.
✅ Structure Shift Markers
Displays triangle markers on the chart when a structural trend shift is detected.
✅ Custom Themes and Design
Choose between three clean themes — Classic, Modern, and Dark — for enhanced readability and aesthetics.
📊 Visual Elements
1). An intuitive table-style dashboard appears in the top-right of the chart.
2). Colored EMA overlays and plotted support/resistance circles on the price chart.
3). Structure shift indicators help visually mark potential change zones.
⚠️ Important Notice:
This tool is intended for educational and informational purposes only. It does not provide financial advice, trade recommendations, or guaranteed outcomes. Always use your own discretion and analysis, and consult a qualified financial professional before making investment decisions.
Trading involves risk and past performance does not guarantee future results.
Open-source script
In true TradingView spirit, the creator of this script has made it open-source, so that traders can review and verify its functionality. Kudos to the author! While you can use it for free, remember that republishing the code is subject to our House Rules.
Disclaimer
The information and publications are not meant to be, and do not constitute, financial, investment, trading, or other types of advice or recommendations supplied or endorsed by TradingView. Read more in the Terms of Use.