OPEN-SOURCE SCRIPT
Updated Median Deviation Bands | QuantumResearch
Introducing QuantumResearch’s Median Deviation Bands Indicator
The Median Deviation Bands indicator is an advanced volatility-based tool designed to help traders identify price trends, market reversals, and potential trading opportunities.
By using a percentile-based median baseline combined with standard deviation bands, this indicator provides a dynamic framework for analyzing price movements and assessing market volatility.
- How It Works
Baseline Calculation:
The median price over a user-defined period (default: 50) is calculated using the 50th percentile of price data.
This serves as the central reference point for trend analysis.
Trend Identification:
Bullish Trend: Occurs when the price crosses above the baseline.
Bearish Trend: Occurs when the price crosses below the baseline.
Deviation Bands:
The indicator plots three sets of upper and lower bands, representing 1x, 2x, and 3x standard deviations from the median.
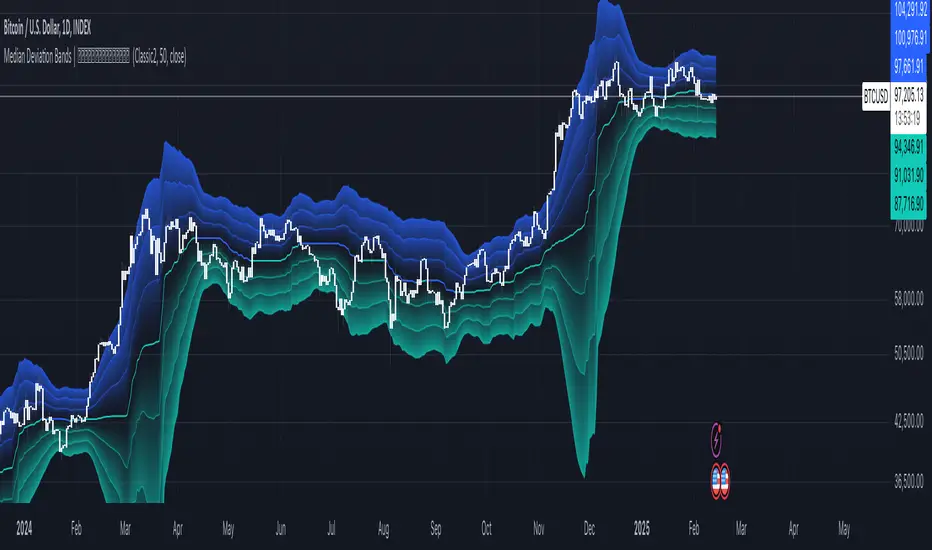
These bands act as dynamic support and resistance zones, helping traders identify overbought and oversold conditions. - Visual Representation
The Median Deviation Bands indicator offers a clear, customizable visual layout: - Color-Coded Baseline:
Green (Bullish): Price is above the median.
Red (Bearish): Price is below the median.
Deviation Bands:
First Band (Light Fill): Represents 1 standard deviation from the baseline.
Second Band (Medium Fill): Represents 2 standard deviations, highlighting stronger trends.
Third Band (Dark Fill): Represents 3 standard deviations, showing extreme price conditions. - Trend Markers:
Green Up Arrows: Indicate the start of a bullish trend when price crosses above the baseline.
Red Down Arrows: Indicate the start of a bearish trend when price crosses below the baseline. - Customization & Parameters
The Median Deviation Bands indicator includes multiple user-configurable settings to adapt to different trading strategies:
Baseline Length: Default set to 50, determines the lookback period for median calculation.
Source Price: Selectable input price for calculations (default: close).
Band Visibility: Traders can toggle individual deviation bands on or off to match their preferences.
Trend Markers: Option to enable or disable up/down trend arrows.
Color Modes: Choose from eight color schemes to customize the indicator’s appearance. - Trading Applications
This indicator is highly versatile and can be applied to multiple trading strategies, including:
Volatility-Based Trading: Price movement within and outside the bands helps traders gauge volatility and market conditions.
Trend Following: The baseline and deviation bands help confirm ongoing trends.
Mean Reversion Strategies: Traders can look for price reactions at extreme bands (±3 standard deviations). - Final Note
QuantumResearch’s Median Deviation Bands indicator provides a unique approach to market analysis by integrating percentile-based median price levels with standard deviation-based volatility bands.
This combination helps traders understand price behavior in relation to historical volatility, making it a valuable tool for both trend-following and mean-reversion strategies.
As always, backtesting and customization are recommended to optimize performance across different market conditions.
Release Notes
Adding the step.Release Notes
Added alert conditionOpen-source script
In true TradingView spirit, the creator of this script has made it open-source, so that traders can review and verify its functionality. Kudos to the author! While you can use it for free, remember that republishing the code is subject to our House Rules.
🌐 Gain access to our cutting-edge tools:
whop.com/quantum-whop/
⚒️ Get access to our toolbox here for free:
quantumresearchportfolio.carrd.co
All tools and content provided are for informational and educational purposes only.
whop.com/quantum-whop/
⚒️ Get access to our toolbox here for free:
quantumresearchportfolio.carrd.co
All tools and content provided are for informational and educational purposes only.
Disclaimer
The information and publications are not meant to be, and do not constitute, financial, investment, trading, or other types of advice or recommendations supplied or endorsed by TradingView. Read more in the Terms of Use.
Open-source script
In true TradingView spirit, the creator of this script has made it open-source, so that traders can review and verify its functionality. Kudos to the author! While you can use it for free, remember that republishing the code is subject to our House Rules.
🌐 Gain access to our cutting-edge tools:
whop.com/quantum-whop/
⚒️ Get access to our toolbox here for free:
quantumresearchportfolio.carrd.co
All tools and content provided are for informational and educational purposes only.
whop.com/quantum-whop/
⚒️ Get access to our toolbox here for free:
quantumresearchportfolio.carrd.co
All tools and content provided are for informational and educational purposes only.
Disclaimer
The information and publications are not meant to be, and do not constitute, financial, investment, trading, or other types of advice or recommendations supplied or endorsed by TradingView. Read more in the Terms of Use.