OPEN-SOURCE SCRIPT
Higher Time Frame levels
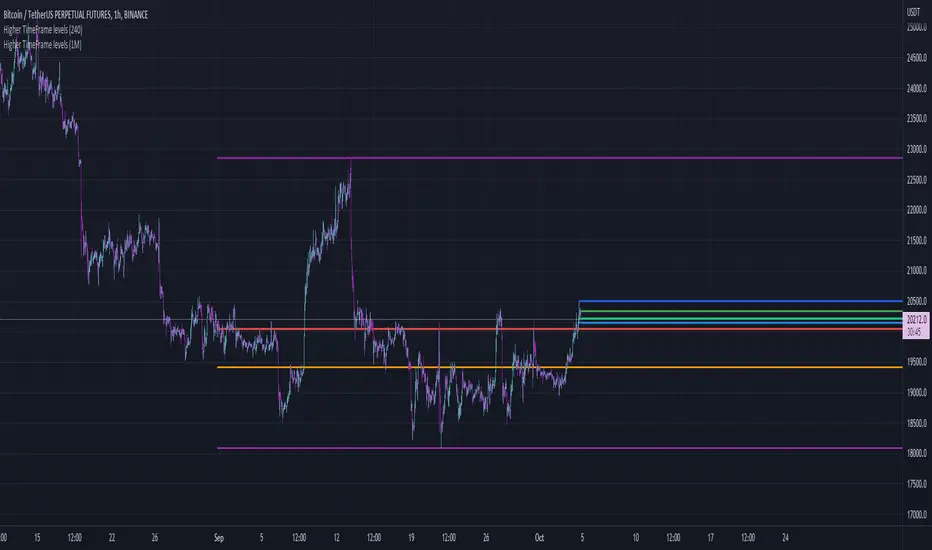
Simple script to see where the hloc levels are on the last confirmed candle on a higher timeframe. Good for keeping a eye on the monthly or weekly levels . NOTE if you are using the script on monthly setting and are currently on a lower timeframe (15min ) and do not see the lines rendering you just need to move your chart to the left to get the start point of the line to appear on screen, then tradingview will render the lines.
Release Notes
Added Some color options for the Level Lines. I have also added the functionality to set color profiles for up candles and down candles. This allows the script to communicate to the user what direction price was moving during the Higher timeframe candle.Open-source script
In true TradingView spirit, the creator of this script has made it open-source, so that traders can review and verify its functionality. Kudos to the author! While you can use it for free, remember that republishing the code is subject to our House Rules.
Disclaimer
The information and publications are not meant to be, and do not constitute, financial, investment, trading, or other types of advice or recommendations supplied or endorsed by TradingView. Read more in the Terms of Use.
Open-source script
In true TradingView spirit, the creator of this script has made it open-source, so that traders can review and verify its functionality. Kudos to the author! While you can use it for free, remember that republishing the code is subject to our House Rules.
Disclaimer
The information and publications are not meant to be, and do not constitute, financial, investment, trading, or other types of advice or recommendations supplied or endorsed by TradingView. Read more in the Terms of Use.