OPEN-SOURCE SCRIPT
Updated NYSE UVOL Ratio
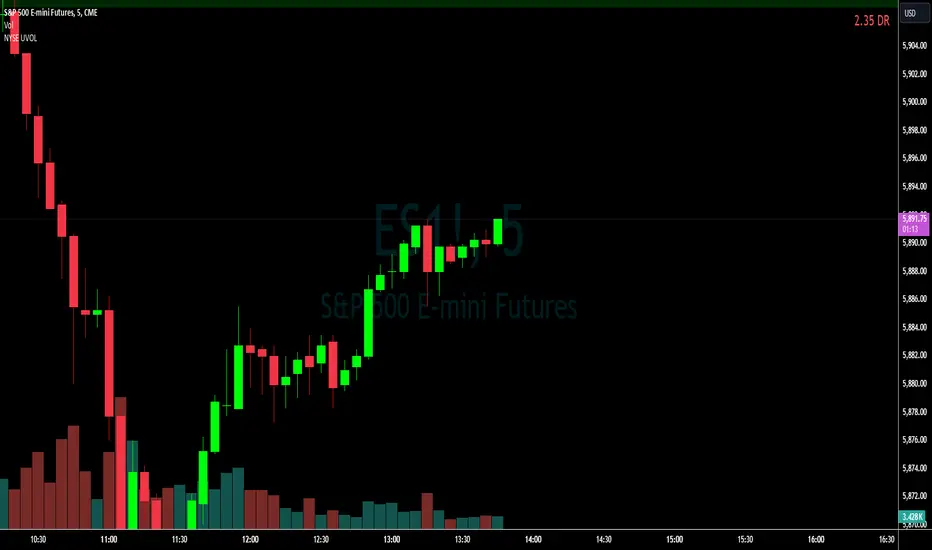
This Pine Script is designed to monitor and display the ratio of advancing volume (UVOL) to declining volume (DVOL) on the NYSE in real-time on your TradingView charts. Here's a breakdown of what each part of the script does:
Indicator Declaration: The script starts by declaring an indicator called "NYSE UVOL" with the option to overlay it directly on the price chart. This allows you to see the volume ratio in context with price movements.
Volume Data Fetching:
Advancing Volume (UVOL): It retrieves the closing value of the advancing volume from the NYSE.
Declining Volume (DVOL): It fetches the closing value of the declining volume.
Ratio Calculation:
The script calculates the ratio of advancing to declining volume. To avoid division by zero, it checks if the declining volume is not zero before performing the division.
Color Coding:
The script assigns a color to the ratio value based on set thresholds:
Red for a ratio less than 1 (more declining than advancing volume).
White for ratios between 1 and 2.
Lime for ratios between 2 and 3.
Green for ratios above 3.
Display Table:
A table is created in the top-right corner of the chart to display the current ratio value.
It updates this table with the latest ratio value at each new bar, displaying the ratio with appropriate color coding for quick reference.
This script provides a visual and numerical representation of market sentiment based on volume data, aiding traders in assessing the balance between buying and selling pressure.
Release Notes
Modified to avoid fractions when DVOL greater than UVOL.New values are displayed in red when DVOL exceeds UVOL and green when UVOL exceeds DVOL.
Open-source script
In true TradingView spirit, the creator of this script has made it open-source, so that traders can review and verify its functionality. Kudos to the author! While you can use it for free, remember that republishing the code is subject to our House Rules.
Disclaimer
The information and publications are not meant to be, and do not constitute, financial, investment, trading, or other types of advice or recommendations supplied or endorsed by TradingView. Read more in the Terms of Use.