OPEN-SOURCE SCRIPT
Updated Highest Price Marker
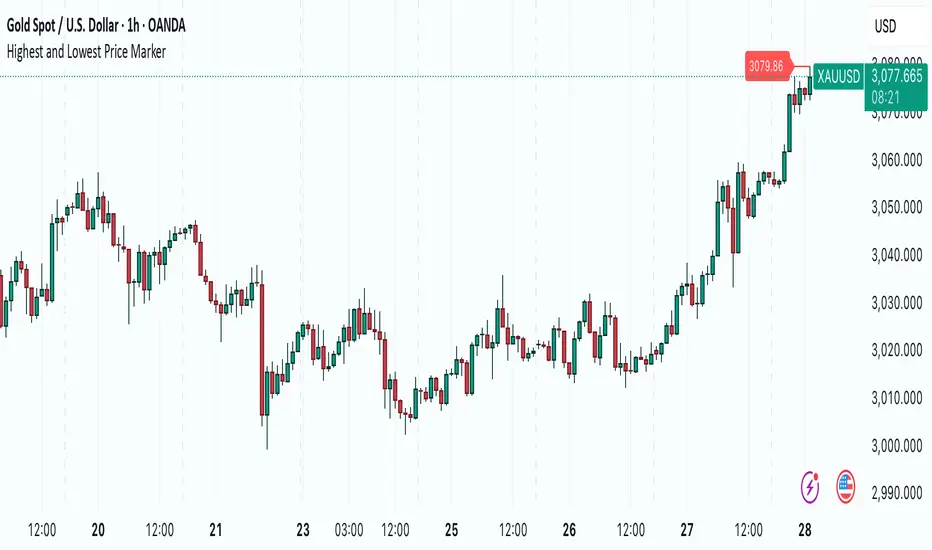
Highest Price Marker – Smart Label & Line Indicator
This Pine Script v5 indicator highlights the highest price reached within the last 100 bars on your chart. It visually enhances key price levels by:
✅ Placing a label at the highest price, positioned 3 candles to the left for clarity.
✅ Drawing a line connecting the label to the actual high for better visibility.
✅ Auto-updating dynamically whenever a new highest price is detected.
This is useful for traders who want to quickly identify resistance levels or analyze historical price peaks without cluttering the chart.
🔹 How to Use:
Add the indicator to your chart.
Look for the red label marking the highest price within the last 100 bars.
The horizontal line helps track the exact price level.
💡 Customization Ideas:
Adjust the lookback period (length = 100) to detect longer or shorter trends.
Modify colors or label positioning to suit your preferences.
🚀 Perfect for:
🔸 Price Action Traders
🔸 Swing & Breakout Traders
🔸 Support & Resistance Analysis
Release Notes
This indicator scans the past 100 bars to pinpoint the most extreme price levels, marking the highest and lowest values on your chart. It adds dynamic labels and connecting lines that visually capture these key price points, providing you with a clear reference of where significant price movements have occurred over your chosen period.By displaying these price markers in real time, the tool gives you an intuitive snapshot of market extremes, enabling you to better monitor sudden shifts and evaluate market sentiment. Whether you're tracking intraday volatility or analyzing longer-term trends, this indicator serves as a practical guide to the price action that matters most.
Open-source script
In true TradingView spirit, the creator of this script has made it open-source, so that traders can review and verify its functionality. Kudos to the author! While you can use it for free, remember that republishing the code is subject to our House Rules.
Disclaimer
The information and publications are not meant to be, and do not constitute, financial, investment, trading, or other types of advice or recommendations supplied or endorsed by TradingView. Read more in the Terms of Use.