OPEN-SOURCE SCRIPT
Updated Volume Candles
Volume Candles — Context-Aware Candle Color
Description:
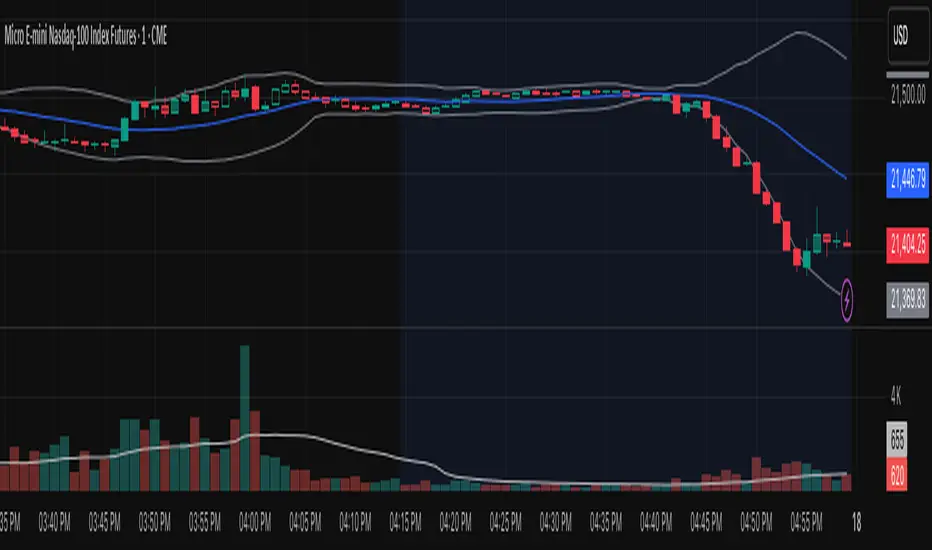
This visual indicator colors your price candles based on relative volume intensity, helping traders instantly detect low, medium, and high volume activity at a glance. It supports two modes — Percentile Ranking and Volume Average — offering flexible interpretation of volume pressure across all timeframes.
It uses a 3-tiered color system (bright, medium, dark) with customizable tones for both bullish and bearish candles.
How It Works:
You can choose between two modes for volume classification:
Ranking Mode (Default):
Measures current volume’s percentile rank over a lookback period. Higher percentiles = stronger color intensity.
Percentile thresholds:
Volume Average Mode:
Compares current volume against its simple moving average (SMA).
Volume thresholds:
Candle Paint:
Candles are colored directly on the chart, not in a separate pane. Bullish candles use green shades, bearish use red. All colors are fully customizable.
How to Interpret:
Example Use Cases:
Inputs & Settings:
Best For:
Pro Tips:
Description:
This visual indicator colors your price candles based on relative volume intensity, helping traders instantly detect low, medium, and high volume activity at a glance. It supports two modes — Percentile Ranking and Volume Average — offering flexible interpretation of volume pressure across all timeframes.
It uses a 3-tiered color system (bright, medium, dark) with customizable tones for both bullish and bearish candles.
How It Works:
You can choose between two modes for volume classification:
Ranking Mode (Default):
Measures current volume’s percentile rank over a lookback period. Higher percentiles = stronger color intensity.
Percentile thresholds:
- < 50% → light color (low volume)
- 50–80% → medium intensity
- > 80% → high volume
Volume Average Mode:
Compares current volume against its simple moving average (SMA).
Volume thresholds:
- < 0.5× SMA → light color
- Between 0.5× and 1.5× → medium
- > 1.5× → high intensity
Candle Paint:
Candles are colored directly on the chart, not in a separate pane. Bullish candles use green shades, bearish use red. All colors are fully customizable.
How to Interpret:
- Bright Colors = High volume (potential strength or climax)
- Muted/Transparent Colors = Low or average volume (consolidation, traps)
Example Use Cases:
- Spot fakeouts with large price movement on weak volume (dark color)
- Confirm breakout strength with bright candles
- Identify stealth accumulation/distribution
Inputs & Settings:
- Mode: Ranking Percentile or Volume Average
- Lookback Period for ranking and SMA
- Custom Colors for bullish and bearish candles at 3 intensity levels
Best For:
- Price action traders wanting context behind each candle
- Scalpers and intraday traders needing real-time volume feedback
- Anyone using volume as a filter for entries or breakouts
Pro Tips:
- Combine with Price Action, Bollinger Bands or VWAP/EMA levels to confirm breakout validity and intent behind a move.
- Use alongside RSI/MACD divergences for high-volume reversal signals.
- For swing trading, expand the lookback period to better normalize volume over longer trends.
Release Notes
Volume Candles — Context-Aware Candle ColorDescription:
This visual indicator colors your price candles based on relative volume intensity, helping traders instantly detect low, medium, and high volume activity at a glance. It supports two modes — Percentile Ranking and Volume Average — offering flexible interpretation of volume pressure across all timeframes.
It uses a 3-tiered color system (bright, medium, dark) with customizable tones for both bullish and bearish candles.
How It Works:
You can choose between two modes for volume classification:
Ranking Mode (Default):
Measures current volume’s percentile rank over a lookback period. Higher percentiles = stronger color intensity.
Percentile thresholds:
- < 50% → light color (low volume)
- 50–80% → medium intensity
- > 80% → high volume
Volume Average Mode:
Compares current volume against its simple moving average (SMA).
Volume thresholds:
- < 0.5× SMA → light color
- Between 0.5× and 1.5× → medium
- > 1.5× → high intensity
Candle Paint:
Candles are colored directly on the chart, not in a separate pane. Bullish candles use green shades, bearish use red. All colors are fully customizable.
How to Interpret:
- Bright Colors = High volume (potential strength or climax)
- Muted/Transparent Colors = Low or average volume (consolidation, traps)
Example Use Cases:
- Spot fakeouts with large price movement on weak volume (dark color)
- Confirm breakout strength with bright candles
- Identify stealth accumulation/distribution
Inputs & Settings:
- Mode: Ranking Percentile or Volume Average
- Lookback Period for ranking and SMA
- Custom Colors for bullish and bearish candles at 3 intensity levels
Best For:
- Price action traders wanting context behind each candle
- Scalpers and intraday traders needing real-time volume feedback
- Anyone using volume as a filter for entries or breakouts
Pro Tips:
- Combine with Price Action, Bollinger Bands or VWAP/EMA levels to confirm breakout validity and intent behind a move.
- Use alongside RSI/MACD divergences for high-volume reversal signals.
- For swing trading, expand the lookback period to better normalize volume over longer trends.
Open-source script
In true TradingView spirit, the creator of this script has made it open-source, so that traders can review and verify its functionality. Kudos to the author! While you can use it for free, remember that republishing the code is subject to our House Rules.
Disclaimer
The information and publications are not meant to be, and do not constitute, financial, investment, trading, or other types of advice or recommendations supplied or endorsed by TradingView. Read more in the Terms of Use.