OPEN-SOURCE SCRIPT
EMA x4
📌 Indicator: EMA x4
Author: [@leonardoaranibar294]
Script Type: Overlay (draws on price chart)
Language: Pine Script™ v6
License: Mozilla Public License 2.0
📖 Overview
EMA x4 is a minimalist technical indicator designed to display four customizable Exponential Moving Averages (EMAs) directly on the chart. It offers a clear view of short-, medium-, long-, and extra-long-term trends to support trend-following and momentum-based trading strategies.
This tool is ideal for traders who rely on moving average crossovers, dynamic support/resistance, or need to confirm market bias with multiple time-frame alignment.
⚙️ Input Parameters
Users can modify each EMA's length to match their strategy preferences:
Short EMA: Fastest EMA for short-term by default its value is 35
Middle EMA: Medium-term EMA by default its value is 75
Large EMA: Long-term EMA by default its value is 100
XL - EMA: Extra-long-term trend filter by default its value is 200
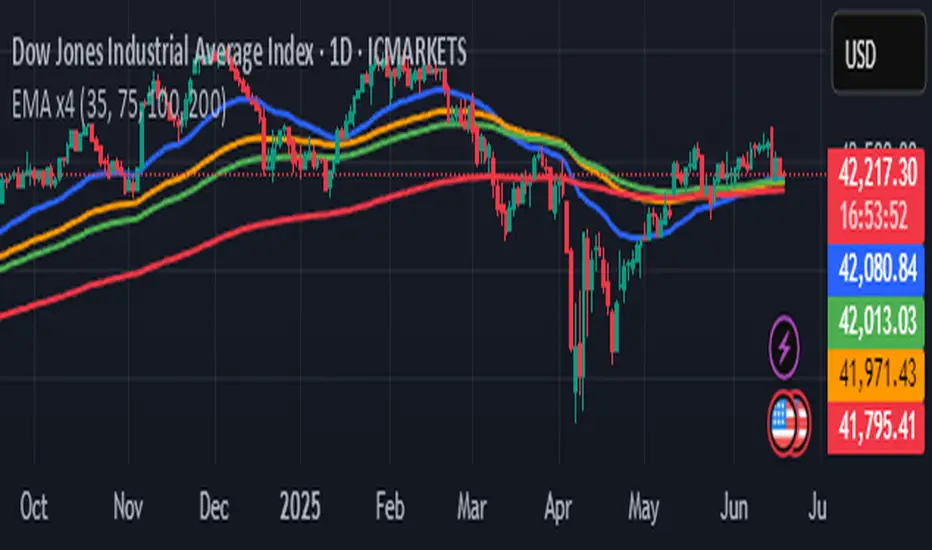
📊 Visual Representation
The script plots each EMA using distinct colors and consistent line thickness:
EMA1: Color Blue Short-term EMA (35)
EMA2: Color Orange Mid-term EMA (75)
EMA3: Color Green Long-term EMA (100)
EMA4: Color Red Extra-long-term EMA (200)
All lines are rendered with a linewidth of 2 for enhanced visibility on any chart.
🧠 Typical Use Cases
Trend Identification: Watch for the EMAs stacking in order (e.g., EMA1 above EMA2, etc.) to confirm bullish or bearish trends.
Crossover Signals: Look for EMA crossovers to generate entry/exit signals.
Support & Resistance: EMAs often act as dynamic zones of support/resistance during trending markets.
Multi-timeframe Confirmation: Combine this overlay with higher timeframe charts to confirm trend alignment.
✅ Key Benefits
Fully customizable EMA lengths for all trading styles.
Clean design, ideal for visually-driven traders.
Lightweight code – no lag or performance impact.
Can be used in confluence with other indicators or strategies.
🚀 How to Use
Add the indicator to any TradingView chart.
Configure the EMA lengths based on your preference (swing, day trading, long-term).
Analyze price interactions with the EMAs and look for confluences or crossovers.
Author: [@leonardoaranibar294]
Script Type: Overlay (draws on price chart)
Language: Pine Script™ v6
License: Mozilla Public License 2.0
📖 Overview
EMA x4 is a minimalist technical indicator designed to display four customizable Exponential Moving Averages (EMAs) directly on the chart. It offers a clear view of short-, medium-, long-, and extra-long-term trends to support trend-following and momentum-based trading strategies.
This tool is ideal for traders who rely on moving average crossovers, dynamic support/resistance, or need to confirm market bias with multiple time-frame alignment.
⚙️ Input Parameters
Users can modify each EMA's length to match their strategy preferences:
Short EMA: Fastest EMA for short-term by default its value is 35
Middle EMA: Medium-term EMA by default its value is 75
Large EMA: Long-term EMA by default its value is 100
XL - EMA: Extra-long-term trend filter by default its value is 200
📊 Visual Representation
The script plots each EMA using distinct colors and consistent line thickness:
EMA1: Color Blue Short-term EMA (35)
EMA2: Color Orange Mid-term EMA (75)
EMA3: Color Green Long-term EMA (100)
EMA4: Color Red Extra-long-term EMA (200)
All lines are rendered with a linewidth of 2 for enhanced visibility on any chart.
🧠 Typical Use Cases
Trend Identification: Watch for the EMAs stacking in order (e.g., EMA1 above EMA2, etc.) to confirm bullish or bearish trends.
Crossover Signals: Look for EMA crossovers to generate entry/exit signals.
Support & Resistance: EMAs often act as dynamic zones of support/resistance during trending markets.
Multi-timeframe Confirmation: Combine this overlay with higher timeframe charts to confirm trend alignment.
✅ Key Benefits
Fully customizable EMA lengths for all trading styles.
Clean design, ideal for visually-driven traders.
Lightweight code – no lag or performance impact.
Can be used in confluence with other indicators or strategies.
🚀 How to Use
Add the indicator to any TradingView chart.
Configure the EMA lengths based on your preference (swing, day trading, long-term).
Analyze price interactions with the EMAs and look for confluences or crossovers.
Open-source script
In true TradingView spirit, the creator of this script has made it open-source, so that traders can review and verify its functionality. Kudos to the author! While you can use it for free, remember that republishing the code is subject to our House Rules.
Disclaimer
The information and publications are not meant to be, and do not constitute, financial, investment, trading, or other types of advice or recommendations supplied or endorsed by TradingView. Read more in the Terms of Use.