OPEN-SOURCE SCRIPT
Updated Fibonacci Retracement levels Automatically D/W/M
Indicator Description: Fibonacci Retracement levels Automatically
Fibonacci retracement levels based on the day, week, month High Low range and Fibonacci retracement levels draws automatically .This Pine Script indicator is designed to plot Fibonacci retracement levels based on the high and low prices of a user-selected timeframe (Daily, Weekly, or Monthly). It identifies bullish or bearish candles in the chosen timeframe, draws key price levels, and overlays Fibonacci retracement lines and semi-transparent colored boxes to highlight potential support and resistance zones. The indicator dynamically updates with each new period and extends lines, labels, and boxes to the current bar for real-time visualization. Key Features
1. Timeframe Selection: Users can choose the timeframe for analysis: Daily, Weekly, or Monthly via an input dropdown. The indicator retrieves the open, high, low, and close prices for the selected timeframe using `request.security`.
2. High and Low Tracking : Tracks the highest high and lowest low within the selected timeframe. Stores these values and their corresponding bar indices in arrays (`whigh`, `wlow`, `whighIdx`,`wlowIdx`). Limits the array size to the most recent period to optimize performance.
3. Bullish and Bearish Candle Detection : Identifies whether the previous period’s candle is bullish (`close > open`) or bearish (`close < open`). Uses this to determine the direction for Fibonacci retracement calculations. Bullish candle: Fibonacci levels are drawn from low to high
Bearish candle: Fibonacci levels are drawn from high to low
4. Fibonacci Retracement Levels : Plots Fibonacci levels at 0.236, 0.382, 0.5, 0.618, and 0.786 between the high and low of the period. For bullish candles, levels are calculated from the low (support) to the high (resistance). For bearish candles, levels are calculated from the high (resistance) to the low (support). Each Fibonacci level is drawn as a horizontal line with a unique color:
- 0.236: Blue
- 0.382: Purple
- 0.5: Yellow
- 0.618: Teal
- 0.786: Fuchsia
5. Visual Elements: - High/Low Lines and Labels: Draws a red line and label for the previous period’s high. Draws a green line and label for the previous period’s low. Fibonacci Lines and Labels: Each Fibonacci level has a horizontal line and a label displaying the ratio.
Colored Boxes: Semi-transparent boxes are drawn between consecutive Fibonacci levels (including high and low) to highlight zones.
6. Dynamic Updates:
- At the start of a new period (e.g., new week for Weekly timeframe), the indicator:
- Clears previous Fibonacci lines, labels, and boxes.
- Recalculates the high and low for the new period.
- Redraws lines, labels, and boxes based on the new data.
- Extends all lines, labels, and boxes to the current bar index for real-time tracking.
7. Performance Optimization:
- Deletes old lines, labels, and boxes to prevent clutter.
- Limits the storage of highs and lows to the most recent period.
How It Works
1. Initialization: Defines variables for tracking bullish/bearish candles, lines, labels, and arrays for Fibonacci levels and boxes. Sets up color arrays for Fibonacci lines and boxes with distinct, semi-transparent colors.
2. Data Collection: Fetches the previous period’s OHLC (open, high, low, close) using `request.security`. Detects new periods (e.g., new week or month) using `ta.change(time(tf))`.
3. Fibonacci Calculation: On a new period, stores the high and low prices and their bar indices.
- Identifies the maximum high and minimum low from the stored data. - Calculates Fibonacci levels based on the range (`maxHigh - minLow`) and the direction (bullish or bearish).
4. Drawing:
- Draws high/low lines and labels at the identified price levels. Plots Fibonacci retracement lines and labels for each ratio. Creates semi-transparent boxes between Fibonacci levels to visually distinguish zones.
5. Updates:
- Extends all lines, labels, and boxes to the current bar index when a new period is detected. Clears old Fibonacci elements to avoid overlap and ensure clarity.
Usage
- Purpose: This indicator is useful for traders who use Fibonacci retracement levels to identify potential support and resistance zones in financial markets.
- Application:
- Select the desired timeframe (Daily, Weekly, Monthly) via the input settings.
- The indicator automatically plots the previous period’s high/low and Fibonacci levels on the chart.
- Use the labeled Fibonacci levels and colored boxes to identify key price zones for trading decisions.
- Customization:
- Modify the `timeframe` input to switch between Daily, Weekly, or Monthly analysis.
- Adjust the `fibLineColors` and `fibFillColors` arrays to change the visual appearance of lines and boxes.
- The indicator is designed for use on TradingView with Pine Script.
- The maximum array size for highs/lows is limited to 1 period in this version (can be adjusted by modifying the `array.shift` logic).
- The indicator dynamically updates with each new period, ensuring real-time relevance.
This indicator make educational purpose use only
Release Notes
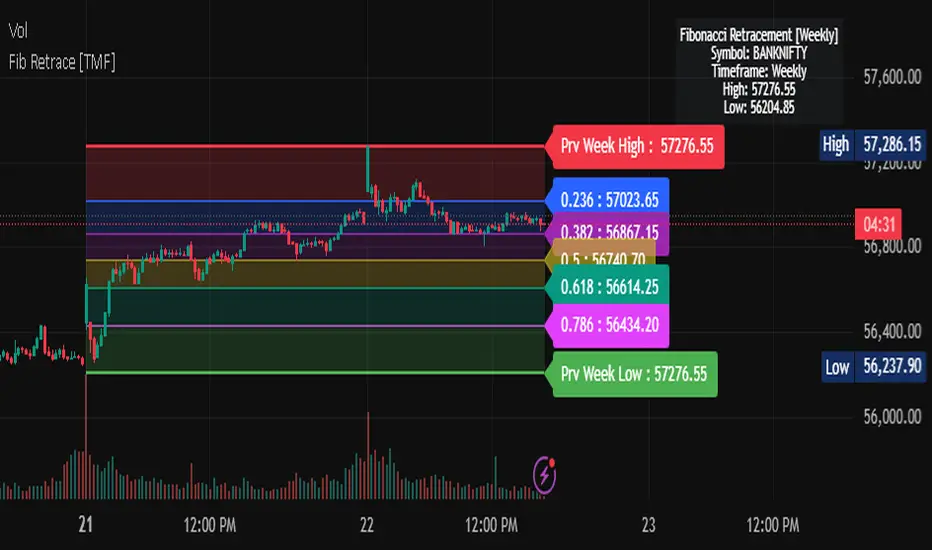
Indicator Description for TradingView PublicationTitle: Fibonacci Retracement Levels - Auto Pivot/D/W/M [TMF]
Short Title: Fib Retrace [TMF]
Description:
The Fibonacci Retracement Levels - Auto Pivot/D/W/M [TMF] is a powerful, automated indicator that plots Fibonacci retracement levels (0.236, 0.382, 0.5, 0.618, 0.786) based on user-selected timeframes: Pivot High/Low, Daily, Weekly, or Monthly. It dynamically identifies significant swing highs and lows, drawing color-coded Fibonacci levels, price labels, and semi-transparent zones to highlight potential support and resistance areas. With real-time updates and customizable settings, this indicator is perfect for traders seeking precise, multi-timeframe analysis across stocks, forex, crypto, and commodities.
Key Features:
• Multi-Timeframe Flexibility: Choose between Pivot High/Low, Daily, Weekly, or Monthly to calculate Fibonacci levels based on significant price points.
• Smart Pivot Detection: Automatically detects pivot highs/lows or uses OHLC data from higher timeframes for reliable level plotting.
• Context-Aware Logic: Adjusts retracement direction based on bullish (close > open) or bearish (close < open) conditions.
• Visual Clarity: Displays color-coded Fibonacci lines, price labels, semi-transparent zones, and an info panel with symbol, timeframe, and high/low values.
• Customizable Settings: Adjust pivot sensitivity, toggle zones/info panel, and set line widths for personalized analysis.
• Dynamic Updates: Levels, labels, and zones update in real-time as new highs/lows form or periods change.
How It Works:
1. Timeframe Selection: Select Pivot High/Low for swing-based analysis or Daily/Weekly/Monthly for higher timeframe extremes.
2. Pivot/OHLC Detection: Uses ta.pivothigh/ta.pivotlow for pivots or OHLC data (syminfo.tickerid) for timeframe-based highs/lows.
3. Fibonacci Calculation: Plots retracement levels (0.236, 0.382, 0.5, 0.618, 0.786) based on the range between detected highs and lows.
4. Visual Output:
o Lines: High/low (red/green) and Fibonacci levels (blue, purple, yellow, green, orange).
o Labels: Show timeframe (e.g., "Daily High", "Weekly Low") and precise price values (format.mintick).
o Zones: Semi-transparent colored boxes (red, blue, purple, yellow, green) between levels.
o Info Panel: Displays symbol, timeframe, and current high/low in a top-right table.
5. Real-Time Updates: Lines, labels, and zones extend to the current bar and refresh on new pivot/period triggers.
Settings:
• Timeframe: Pivot High/Low, Daily, Weekly, or Monthly.
• Pivot Lookback Left: Bars to look back for pivot detection (default: 20).
• Pivot Wait Right: Bars to confirm pivots (default: 10).
• Show Info Label: Toggle info panel (default: true).
Symbol and Timeframe Information:
• Symbol: Displayed via syminfo.ticker in the info panel (e.g., BTCUSD).
• Timeframe: Labeled as "Pivot", "Daily", "Weekly", or "Monthly" in labels and info panel.
• Script Name: Fibonacci Retracement Levels - Auto Pivot/D/W/M [TMF].
Script Information:
• Full Name: Fibonacci Retracement Levels - Auto Pivot/D/W/M [TMF]
• Short Name: Fib Retrace [TMF]
• Pine Script Version: version=5 (optimized for stability)
• Overlay: True (plots directly on the chart)
• Max Bars Back: 5000 (ensures performance with sufficient historical data)
• Max Labels/Lines/Boxes: 500 each (prevents rendering issues)
Usage:
1. Apply to any TradingView chart.
2. Select a timeframe and adjust pivot settings to match your trading style (e.g., shorter lookback for intraday, longer for swing trading).
3. Use Fibonacci levels and zones to identify potential reversal or confluence zones.
4. Combine with volume profile, momentum indicators, or other tools for enhanced analysis.
5. Ideal for swing traders, day traders, and multi-timeframe strategists across all markets.
Notes:
• Optimized to prevent chart clutter by clearing outdated drawings on new highs/lows or period changes.
• Uses distinct colors (red, blue, purple, yellow, green, orange) for clear differentiation of levels and zones.
• Best results on 1H charts or higher; adjust pivot sensitivity for lower timeframes.
• Performance-tuned to avoid TradingView’s rendering limits (e.g., max 50 labels/lines/boxes).
Example Use Case:
On a 1H BTC/USD chart, select "Weekly" timeframe to plot Fibonacci levels based on the previous week’s high/low. The indicator draws levels (e.g., 0.618 at $46,000) with colored zones and labels, helping identify key support/resistance for swing trades. The info panel shows: "Symbol: BTCUSD, Timeframe: Weekly, High: $50,000, Low: $40,000."
Author: [Arvind Ghadge, Trend_MyFrend]
Version: 2.0
Updated: 22 July 2025
Release Notes
Text Color customOpen-source script
In true TradingView spirit, the creator of this script has made it open-source, so that traders can review and verify its functionality. Kudos to the author! While you can use it for free, remember that republishing the code is subject to our House Rules.
mail Id : satyambeed@gmail.com
WhatsApp +919270007010
Telegram : @AI_Trend_My_Friend forms.gle/H5FUra2tFHn3WR8u6
WhatsApp +919270007010
Telegram : @AI_Trend_My_Friend forms.gle/H5FUra2tFHn3WR8u6
Disclaimer
The information and publications are not meant to be, and do not constitute, financial, investment, trading, or other types of advice or recommendations supplied or endorsed by TradingView. Read more in the Terms of Use.
Open-source script
In true TradingView spirit, the creator of this script has made it open-source, so that traders can review and verify its functionality. Kudos to the author! While you can use it for free, remember that republishing the code is subject to our House Rules.
mail Id : satyambeed@gmail.com
WhatsApp +919270007010
Telegram : @AI_Trend_My_Friend forms.gle/H5FUra2tFHn3WR8u6
WhatsApp +919270007010
Telegram : @AI_Trend_My_Friend forms.gle/H5FUra2tFHn3WR8u6
Disclaimer
The information and publications are not meant to be, and do not constitute, financial, investment, trading, or other types of advice or recommendations supplied or endorsed by TradingView. Read more in the Terms of Use.