OPEN-SOURCE SCRIPT
Updated RSI in Bollinger bands
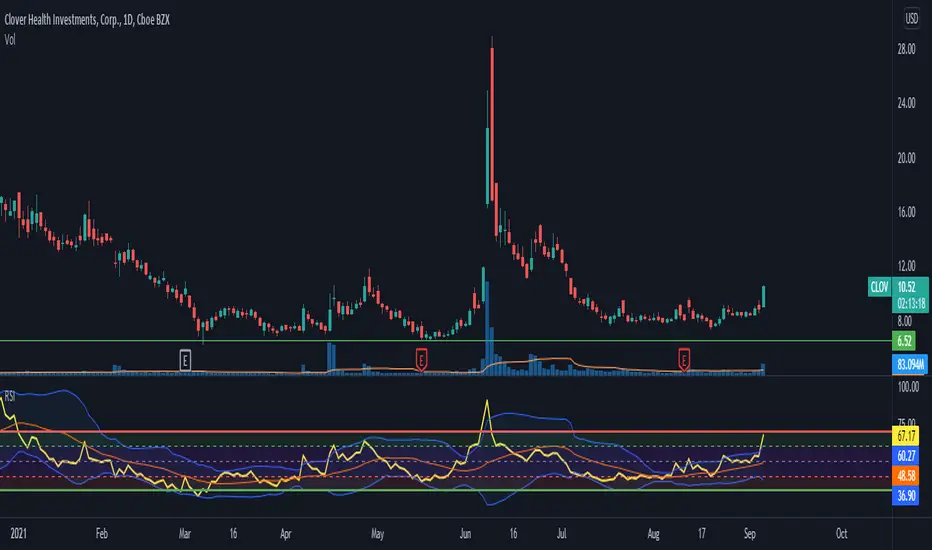
I added Bolinger bands to the RSI indicator.
This shows you the area of reversal for the RSI. Generally, when the indicator falls out of the bands, you'll see a quick reversal. Indeed this is a better way to find the overbought and oversold areas.
This shows you the area of reversal for the RSI. Generally, when the indicator falls out of the bands, you'll see a quick reversal. Indeed this is a better way to find the overbought and oversold areas.
Release Notes
I have updated this indicator and added some levels to it. These levels are adjustable and you can easily modify them. These levels help you to have a better understanding of the trend strength, buy and sell areas and finding new opportunities. Open-source script
In true TradingView spirit, the creator of this script has made it open-source, so that traders can review and verify its functionality. Kudos to the author! While you can use it for free, remember that republishing the code is subject to our House Rules.
Disclaimer
The information and publications are not meant to be, and do not constitute, financial, investment, trading, or other types of advice or recommendations supplied or endorsed by TradingView. Read more in the Terms of Use.
Open-source script
In true TradingView spirit, the creator of this script has made it open-source, so that traders can review and verify its functionality. Kudos to the author! While you can use it for free, remember that republishing the code is subject to our House Rules.
Disclaimer
The information and publications are not meant to be, and do not constitute, financial, investment, trading, or other types of advice or recommendations supplied or endorsed by TradingView. Read more in the Terms of Use.