OPEN-SOURCE SCRIPT
Updated Twin Tower TP Levels – Hopi Method (from Demystifying ICT 2)
📐 Twin Tower TP Levels – Hopi Method (from “Demystifying ICT 2”)
Description:
This indicator visualizes the Twin Tower TP Levels, a concept inspired by the work of the anonymous trader "Hopi", presented in the book "Demystifying ICT 2 (2025 Edition)".
It calculates a set of key take-profit levels based on:
A fixed reference price (typically VWAP at 16:00 EST)
The average daily range (ADR)
A symmetrical unit structure (ADR ÷ 100), projecting levels both above and below the fixed price.
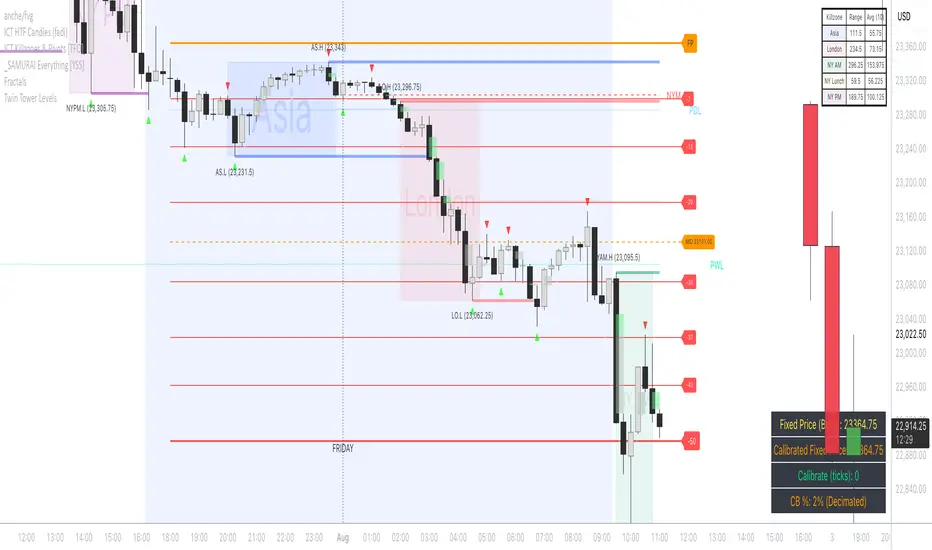
The levels are calculated and labeled at ±7, ±13, ±20, ±30, ±37, ±43, and ±50 units from the Fix Price — providing traders with a balanced range of price action targets and reaction zones.
Key features:
Customizable Fix Price and ADR input
Automatically computes and plots 7 target levels above and below
Color-coded labels for easy reference (green for above, red for below)
Designed for precision take-profit targeting, as conceptualized in the “Twin Tower” method.
Disclaimer:
This script is a fan-made implementation for educational purposes and references concepts discussed in the book "Demystifying ICT 2 (2025 Edition)", attributed to the pseudonymous trader "Hopi".
All rights to the original intellectual property remain with the author.
Description:
This indicator visualizes the Twin Tower TP Levels, a concept inspired by the work of the anonymous trader "Hopi", presented in the book "Demystifying ICT 2 (2025 Edition)".
It calculates a set of key take-profit levels based on:
A fixed reference price (typically VWAP at 16:00 EST)
The average daily range (ADR)
A symmetrical unit structure (ADR ÷ 100), projecting levels both above and below the fixed price.
The levels are calculated and labeled at ±7, ±13, ±20, ±30, ±37, ±43, and ±50 units from the Fix Price — providing traders with a balanced range of price action targets and reaction zones.
Key features:
Customizable Fix Price and ADR input
Automatically computes and plots 7 target levels above and below
Color-coded labels for easy reference (green for above, red for below)
Designed for precision take-profit targeting, as conceptualized in the “Twin Tower” method.
Disclaimer:
This script is a fan-made implementation for educational purposes and references concepts discussed in the book "Demystifying ICT 2 (2025 Edition)", attributed to the pseudonymous trader "Hopi".
All rights to the original intellectual property remain with the author.
Release Notes
// -----------------------------------------------------------------------------// Twin Tower TP Levels – Hopi Method
//
// 📘 Description:
// This script plots clean and accurate levels based on the
// “Twin Tower Trade Plan” method from the book *Demystifying ICT 2* by Hopiplaka.
// It uses a fixed VWAP price at 16:00 EST as the central anchor, and projects
// precise horizontal levels above and below based on a structured range model.
//
// ✅ What’s improved:
// – Lines are drawn horizontally and end exactly at the current price bar.
// – Labels are clean digits only, no background, placed at the edge of each level.
// – No default TradingView tags or extra visuals — just pure, minimal structure.
//
// ⚠️ Important:
// This script is not financial advice. It is provided solely for educational and
analytical purposes as a personal implementation of an idea from the book.
//
// 🙏 Special thanks to the author: Hopiplaka
// Copyright © Hopiplaka 2012–2025. All rights reserved.
// -----------------------------------------------------------------------------
Release Notes
// -----------------------------------------------------------------------------// Twin Tower Levels – Hopi Method
// © Hopiplaka 2012–2025. All rights reserved.
//
// 📘 Description:
// This script plots clean and accurate levels based on the
// “Twin Tower Trade Plan” method from the book *Demystifying ICT 2* by Hopiplaka.
// It uses a fixed VWAP price at 16:00 EST as the central anchor, and projects
// precise horizontal levels above and below using the true 7–6–7–10–7–6–7 sequence.
//
// ✅ What’s improved:
// – Levels are calculated dynamically based on the 7-6-7-10-7-6-7 structure.
// – Lines are drawn horizontally and end at the current price bar.
// – Labels are correctly shown as distance values from the anchor.
// – No default TradingView tags or extra visuals — just pure, minimal structure.
//
// ⚠️ Important:
// This script is not financial advice. It is provided solely for educational and
// analytical purposes as a personal implementation of an idea from the book.
//
// ✨ It’s clean. It’s elegant. It’s deadly accurate.
//
// 🙏 Special thanks to the author: Hopiplaka
// Copyright © Hopiplaka 2012–2025. All rights reserved.
// -----------------------------------------------------------------------------
Release Notes
// -----------------------------------------------------------------------------// Twin Tower Levels – Hopi Method
//
// 📘 Description:
// This script implements the "Twin Tower Trade Plan" level plotting method
// as described by Hopiplaka in the book *Demystifying ICT 2* (2025).
// Concept and original theory by Hopiplaka: hopiplaka.com
// Script logic and code by DeviceAnswered.
//
// ✅ What’s improved:
// – Levels are calculated individually based on the 7-6-7-10-7-6-7 structure.
// – Lines are drawn horizontally and end at the current price bar.
// – Labels are shown as distance values from the anchor, in a clean, minimal style.
// – Minimal design: no default TradingView tags or extra visuals.
//
// ⚠️ Important:
// This script is not financial advice. It is provided solely for educational and
// analytical purposes as a personal implementation of the Twin Tower method.
//
// 🙏 Special thanks to Hopiplaka (author of the original Twin Tower concept).
// Copyright © DeviceAnswered 2024–2025. All rights reserved.
Release Notes
// – Added IMP10, IMP24, IMP36 levels (nodes) above/below Fix Price.Release Notes
How to Use the Twin Tower Levels ScriptFind the Fix Price (VWAP at 16:00 EST)
Get the VWAP price from the last 30 seconds before 16:00 EST (New York time) from the previous trading day.
Enter this value in the script settings as Fix Price.
Find the ADR (Average Daily Range)
Calculate the ADR from the previous day (or use an average ADR for the last 12–30 days, if you prefer).
Enter this value in the script settings as ADR.
Apply the Script on Your Chart
After entering Fix Price and ADR, the script will automatically plot all Twin Tower levels, including IMP10, IMP24, and IMP36, both above and below the center (Fix Price).
Levels will be labeled for easy identification.
Release Notes
Minor fixRelease Notes
Update: Major Logic Fix (v2.0) – CME Circuit Breaker Correct ImplementationWhat’s new:
– The core logic has been fully rewritten for accuracy.
– Now, all Twin Tower levels are calculated strictly according to the original method from Hopiplaka’s “Demystifying ICT 2” (2025).
– The ADR (Average Daily Range) is no longer used. Instead, the calculation uses the official CME Circuit Breaker price limits as published on the CME website (see CME Price Limits page) cmegroup.com/trading/price-limits.html section “Equity Index Price Limits” – use the Upper and Lower values for the current contract.
How it works:
Set CME Price Limits:
– Input the official Upper Circuit Breaker (7%) and Lower Circuit Breaker (7%) for your contract (e.g. NQ, ES) as published by CME Group (CME Price Limits).
Choose Circuit Breaker % Range:
– Select 7%, 3.5%, or 0.7% for your Twin Tower structure (as described by Hopiplaka, see Demystifying ICT 2).
Calculation:
– The Fix Price is calculated as the midpoint between upper and lower circuit breakers.
– The full range (CB %) is split into 50 “units”, and Twin Tower levels are plotted using the exact 7-6-7-10-7-6-7 structure.
– Optionally, midpoints between +20/+30 and -20/-30 are shown for extra precision.
Why this matters:
– This update completely eliminates ADR-based errors and guarantees strict compliance with Hopiplaka’s official method.
– All levels now match the original Twin Tower theory and live charts from Demystifying ICT 2.
Release Notes
fixRelease Notes
min fixRelease Notes
Update:Fixed historical buffer error. Now the script draws lines safely on all timeframes and datasets, with improved stability.
Release Notes
Update v3.0 — Major Additions:Calibration (Ticks):
Added calibration parameter (in ticks) to manually adjust all Twin Tower levels relative to the base Fixed Price. This allows precise alignment with real CME reference values for any contract.
MEMO Table:
New MEMO info table in the bottom right corner. Shows:
Base Fixed Price (CME)
Calibrated Fixed Price (after manual calibration)
Calibration value (ticks)
Circuit Breaker percentage in use
MEMO Visibility:
Option to show or hide the MEMO info table via settings.
Release Notes
Update: Added 0.35% Circuit Breaker OptionNew option: 0.35% Circuit Breaker added to the Circuit Breaker % selector.
Now you can select 0.35% for contracts that require this threshold, in addition to 0.7%, 3.5%, and 7%.
All Twin Tower levels and calculations automatically update based on the selected Circuit Breaker %.
Release Notes
Changelog / What's new:Added complete Circuit Breaker % selector: now supports all main CME levels (3.5%, 7%, 13%, 20%, 30%, 37%, 43%, 50%) and all Decimated levels (÷10) — shown as "0.35% (Decimated)", "0.7% (Decimated)" etc.
Release Notes
New: Added Label Padding option! You can now shift all Twin Tower level labels and lines to the right by any number of bars for a cleaner chart. Toggle padding on/off as needed. All lines are extended to match the labels, so there’s no empty space.Open-source script
In true TradingView spirit, the creator of this script has made it open-source, so that traders can review and verify its functionality. Kudos to the author! While you can use it for free, remember that republishing the code is subject to our House Rules.
Disclaimer
The information and publications are not meant to be, and do not constitute, financial, investment, trading, or other types of advice or recommendations supplied or endorsed by TradingView. Read more in the Terms of Use.
Open-source script
In true TradingView spirit, the creator of this script has made it open-source, so that traders can review and verify its functionality. Kudos to the author! While you can use it for free, remember that republishing the code is subject to our House Rules.
Disclaimer
The information and publications are not meant to be, and do not constitute, financial, investment, trading, or other types of advice or recommendations supplied or endorsed by TradingView. Read more in the Terms of Use.