OPEN-SOURCE SCRIPT
Cartera SuperTrends v4 Public
Description
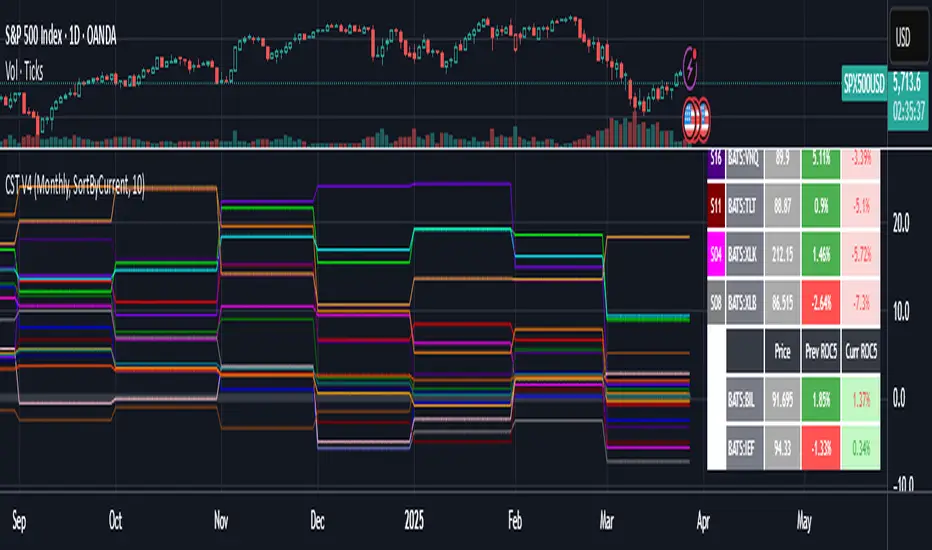
This script creates a screener with a list of ETFs ordered by their average ROC in three different periods representing 4, 6 and 8 months by default. The ETF
BIL
is always included as a reference.
The previous average ROC value shows the calculation using the closing price from last month.
The current average ROC value shows the calculation using the current price.
The previous average column background color represents if the ETF average ROC is positive or negative.
The current average column background color represents if the ETF average ROC is positive or negative.
The current average column letters color represents if the current ETF average ROC is improving or not from the previous month.
Changes from V2 to V3
Added the option to make the calculation monthly, weekly or daily
Changes from V3 to V4
Adding up to 25 symbols
Highlight the number of tickers selected
Highlight the sorted column
Complete refactor of the code using a matrix of arrays
Options
The options available are:
Make the calculation monthly, weekly or daily
Adjust Data for Dividends
Manual calculation instead of using ta.roc function
Sort table
Sort table by the previous average ROC or the current average ROC
Number of tickers selected to highlight
First Period in months, weeks or days
Second Period in months, weeks or days
Third Period in months, weeks or days
Select the assets (max 25)
Usage
Just add the indicator to your favorite indicators and then add it to your chart.
Open-source script
In true TradingView spirit, the creator of this script has made it open-source, so that traders can review and verify its functionality. Kudos to the author! While you can use it for free, remember that republishing the code is subject to our House Rules.
Disclaimer
The information and publications are not meant to be, and do not constitute, financial, investment, trading, or other types of advice or recommendations supplied or endorsed by TradingView. Read more in the Terms of Use.