OPEN-SOURCE SCRIPT
RedAndBlue Indicator Lights
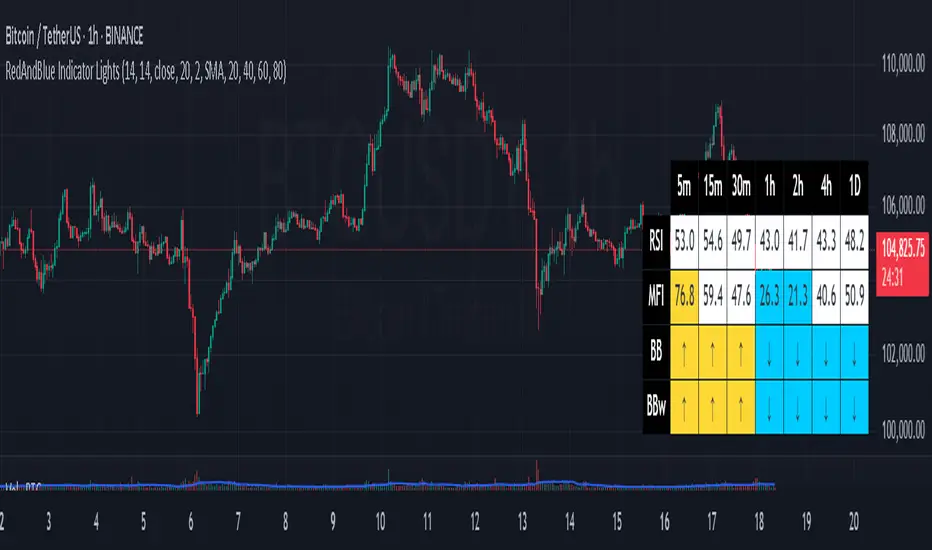
RedAndBlue Indicator Lights — RSI, MFI, and Bollinger Band Sentiment Table
This indicator provides a multi-timeframe sentiment dashboard using RSI, MFI, and Bollinger Bands, visualized in a compact color-coded table.
What it does:
Color meanings:
BB and BBw label meanings:
How to use it effectively:
This indicator helps you quickly identify multi-timeframe sentiment shifts and potential reversal points through a clean, structured visual layout.
This indicator provides a multi-timeframe sentiment dashboard using RSI, MFI, and Bollinger Bands, visualized in a compact color-coded table.
What it does:
- Evaluates RSI and MFI values across multiple timeframes: 5m, 15m, 30m, 1h, 2h, 4h, and 1D
- Analyzes Bollinger Bands in two ways:
BB = compares candle body position relative to Bollinger Bands
BBw = checks whether candle wicks pierce above or below the bands - Each cell displays the indicator value or a symbolic label (↓↓, ↓, –, ↑, ↑↑)
- Color-coded backgrounds reflect overbought/oversold zones
- All thresholds and colors are fully customizable in the input settings
Color meanings:
- Green: Strong oversold (value < low1)
- Light blue: Slightly oversold (value < low2)
- White: Neutral zone (between low2 and high2)
- Yellow: Slightly overbought (value > high2)
- Red: Strong overbought (value > high1)
BB and BBw label meanings:
- ↓↓ = Price (or wick) pierced below the lower Bollinger Band
- ↓ = Candle body is between lower band and midline
- – = Candle body crosses the midline (neutral)
- ↑ = Candle body is between midline and upper band
- ↑↑ = Price (or wick) pierced above the upper Bollinger Band
How to use it effectively:
- If RSI, MFI, BB, and BBw all show oversold signals (green or light blue) across multiple timeframes, especially on 1h, 4h, or 1D, it may signal a good buying opportunity
- If the indicators all show overbought signals (red or yellow), it may indicate a potential exit or short zone
- BBw shows wick-based signals and can act as an early warning; BB confirms with the candle body
- Use this table to spot sentiment confluence across timeframes before entering a trade
- If most cells are white, the market is likely in a sideways or neutral state
This indicator helps you quickly identify multi-timeframe sentiment shifts and potential reversal points through a clean, structured visual layout.
Open-source script
In true TradingView spirit, the creator of this script has made it open-source, so that traders can review and verify its functionality. Kudos to the author! While you can use it for free, remember that republishing the code is subject to our House Rules.
Disclaimer
The information and publications are not meant to be, and do not constitute, financial, investment, trading, or other types of advice or recommendations supplied or endorsed by TradingView. Read more in the Terms of Use.