Witchcraft
There are many uses to this indicator and it will work on any timeframe. It was designed with cryptocurrency markets in mind but you may see success with forex, stocks, or even futures. Best used in a trending market combined with RSAR.
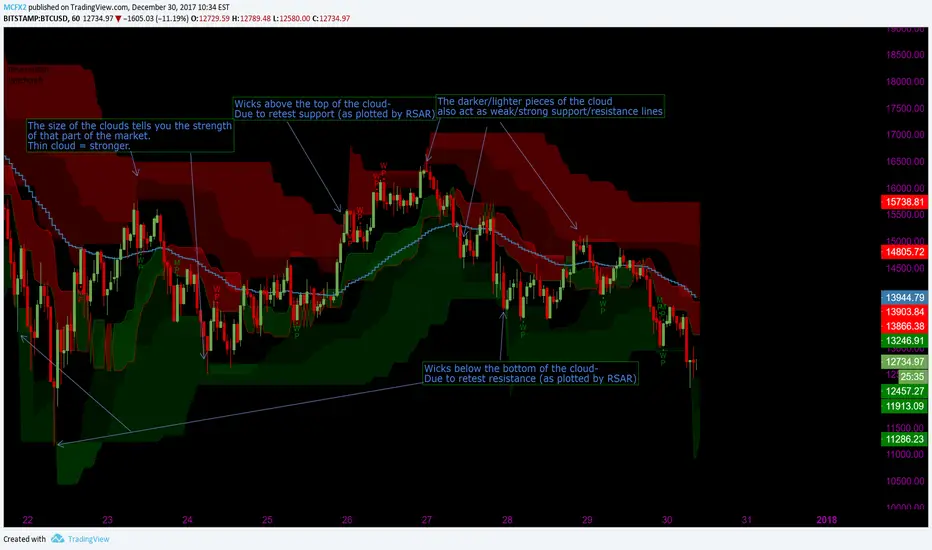
Witchcraft plots two clouds, a red cloud above the price and a green cloud below the price, which indicate support/resistance levels. These clouds are leading, meaning they are known before the price actually reaches that point in time. If you are making a short-term play, then you can identify potential entries/exits ahead of time by looking at the clouds for a longer timeframe.
The clouds will work with Renko charts and Heikin Ashis, but it was designed with regular candlesticks in mind.
Witchcraft can also help you gauge the strength of both sides of the market. The weaker they are, the bigger their cloud (counter-intuitive, i know). This means when you see a very thin buy cloud, it's a good time to look for an entry on a long position (such as inside the buy cloud).
Witchcraft also can replace Bollinger Bands, specifically their sell/buy-zone functions and their ability to predict large price movements. That is, just like on Bollinger Bands, Witchcraft bands will tighten as a big move approaches.
In a strong bear market, you are likely to see the price move in between the green cloud and the RSAR resistance line. Inversely,in a strong bull market most of the price action should occur between the red cloud and the RSAR support line.
Witchcraft, RSAR, and Whale Movement combine to be a very powerful asset. However, no matter what kind of trade setup you prefer, Witchcraft is a powerful tool.
Due to the versatility of this indicator, it can also replace a lot of common indicators and make your charts cleaner. It can take the place of ichimokou cloud, bollinger bands, and even stochrsi/rsi (as there's no longer a need to identify overbought/oversold levels when you can just use the cloud).
On a long position, ideal take-profit points are at the 3 resistances plotted, or potentially the RSAR reversal/support lines depending on where the price is when you enter. On a short position, the ideal exits are obviously the 3 plotted supports.
Good stoplosses are given by RSAR, again depending on where the price is and where your position is. Setting stoplosses based off of Witchcraft is silly since it signals for reversals, so you'd likely get stopped out at the worst possible time.
Invite-only script
Only users approved by the author can access this script. You'll need to request and get permission to use it. This is typically granted after payment. For more details, follow the author's instructions below or contact MCFX2 directly.
TradingView does NOT recommend paying for or using a script unless you fully trust its author and understand how it works. You may also find free, open-source alternatives in our community scripts.
Author's instructions
Warning: please read our guide for invite-only scripts before requesting access.
Disclaimer
Invite-only script
Only users approved by the author can access this script. You'll need to request and get permission to use it. This is typically granted after payment. For more details, follow the author's instructions below or contact MCFX2 directly.
TradingView does NOT recommend paying for or using a script unless you fully trust its author and understand how it works. You may also find free, open-source alternatives in our community scripts.
Author's instructions
Warning: please read our guide for invite-only scripts before requesting access.