OPEN-SOURCE SCRIPT
Ungli
Multi-Indicator Confluence System
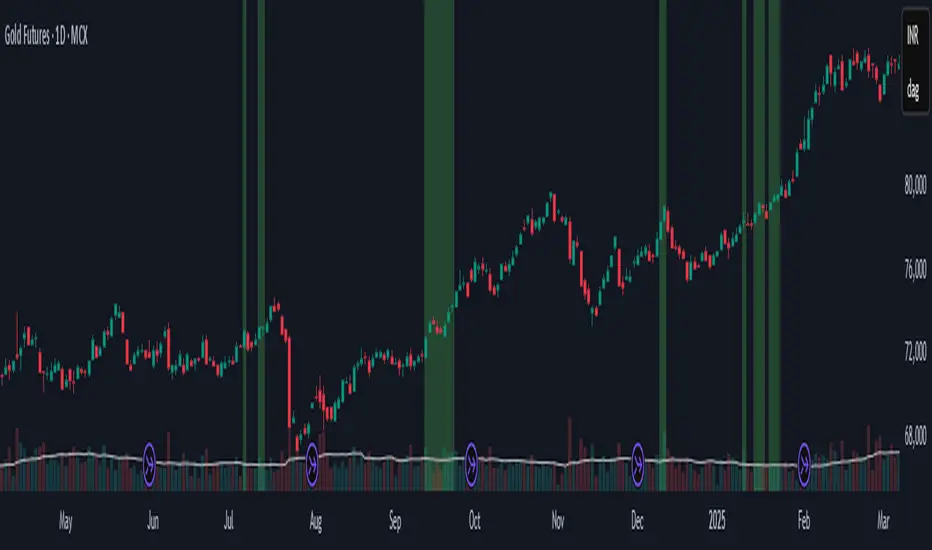
This is a **multi-indicator confluence trading signal system** called "Ungli" that combines RSI, ADX, and MACD to identify high-probability momentum opportunities when used alongside chart pattern and trend line breakouts.
## Core Concept
The script identifies moments when multiple technical indicators align to suggest potential price momentum moves, specifically looking for oversold and overbought conditions with momentum confirmation. Use green and red highlights along with chart patterns and trend line breakouts that signal a breakout for confluence for a likely momentum move.
## Technical Indicators Used
**RSI (Relative Strength Index)**
- Default 14-period RSI
- Oversold threshold: < 40
- Overbought threshold: > 60
**ADX (Average Directional Index)**
- Default 14-period ADX with DI+ and DI-
- Threshold: 21
- Looks for ADX below threshold but ticking upward (momentum building)
**MACD (Moving Average Convergence Divergence)**
- Fast: 12, Slow: 26, Signal: 9
- Uses MACD line direction as trend filter
## Signal Logic
**Green Background (Bullish Momentum Signal):**
- RSI > 60 (overbought)
- ADX < 21 AND rising
- MACD line trending upward
**Red Background (Bearish Momentum Signal):**
- RSI < 40 (oversold)
- ADX < 21 AND rising
- MACD line trending downward
## Key Strategy Elements
1. **Confluence Approach**: Requires all three indicators to align, reducing false signals
2. **Momentum Filter**: ADX must be building (rising) even if low, indicating emerging trend strength
3. **Trend Confirmation**: MACD direction must match the expected move
4. **Visual Simplicity**: Clean background highlighting without chart clutter
5. **Pattern Integration**: Designed to work with chart patterns and breakout strategies
## Use Case
This indicator is designed for swing trading and breakout strategies, identifying moments when oversold/overbought conditions coincide with building momentum in the expected direction. The ADX filter helps avoid choppy, trendless markets. Best used in conjunction with:
- Support/resistance breakouts
- Chart pattern breakouts (triangles, flags, channels)
- Trend line breaks
- Key level violations
The background highlights serve as confluence confirmation when combined with your chart analysis and breakout setups.
Open-source script
In true TradingView spirit, the creator of this script has made it open-source, so that traders can review and verify its functionality. Kudos to the author! While you can use it for free, remember that republishing the code is subject to our House Rules.
Disclaimer
The information and publications are not meant to be, and do not constitute, financial, investment, trading, or other types of advice or recommendations supplied or endorsed by TradingView. Read more in the Terms of Use.