OPEN-SOURCE SCRIPT
Two-Candle Highs & Lows
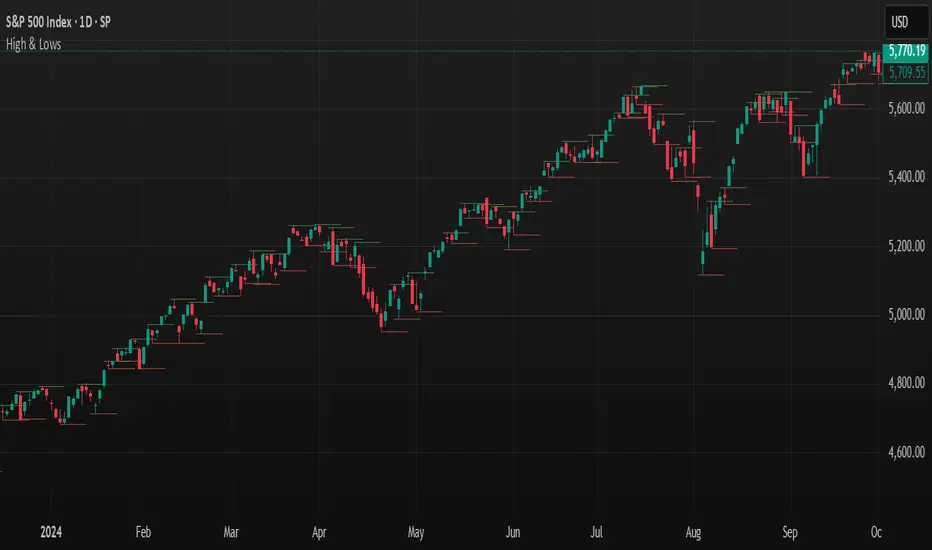
Simple indicator which highlights highs and lows as two-candle reversal patterns:
1. High pattern: A bullish candle followed by a bearish candle, marking the highest price of the two.
2. Low pattern: A bearish candle followed by a bullish candle, marking the lowest price of the two.
It draws horizontal lines at the high/low levels, making it useful for price action analysis such as identifying potential reversals or support/resistance zones.
Open-source script
In true TradingView spirit, the creator of this script has made it open-source, so that traders can review and verify its functionality. Kudos to the author! While you can use it for free, remember that republishing the code is subject to our House Rules.
Disclaimer
The information and publications are not meant to be, and do not constitute, financial, investment, trading, or other types of advice or recommendations supplied or endorsed by TradingView. Read more in the Terms of Use.