OPEN-SOURCE SCRIPT
Approximate Entropy Zones [PhenLabs]
Version: PineScript™ v6
Description
This indicator identifies periods of market complexity and randomness by calculating the Approximate Entropy (ApEn) of price action. As the movement of the market becomes complex, it means the current trend is losing steam and a reversal or consolidation is likely near. The indicator plots high-entropy periods as zones on your chart, providing a graphical suggestion to anticipate a potential market direction change. This indicator is designed to help traders identify favorable times to get in or out of a trade by highlighting when the market is in a state of disarray.
Points of Innovation
Core Components

Key Features

Visualization
Usage Guidelines
Entropy Analysis

Time Settings
Zone Settings
Display Options
Best Use Cases
Limitations
What Makes This Unique
How It Works
Description
This indicator identifies periods of market complexity and randomness by calculating the Approximate Entropy (ApEn) of price action. As the movement of the market becomes complex, it means the current trend is losing steam and a reversal or consolidation is likely near. The indicator plots high-entropy periods as zones on your chart, providing a graphical suggestion to anticipate a potential market direction change. This indicator is designed to help traders identify favorable times to get in or out of a trade by highlighting when the market is in a state of disarray.
Points of Innovation
- Advanced Complexity Analysis: Instead of relying on traditional momentum or trend indicators, this tool uses Approximate Entropy to quantify the unpredictability of price movements.
- Dynamic Zone Creation: It automatically plots zones on the chart during periods of high entropy, providing a clear and intuitive visual guide.
- Customizable Sensitivity: Users can fine-tune the ‘Entropy Threshold’ to adjust how frequently zones appear, allowing for calibration to different assets and timeframes.
- Time-Based Zone Expiration: Zones can be set to expire after a specific time, keeping the chart clean and relevant.
- Built-in Zone Size Filter: Excludes zones that form on excessively large candles, filtering out noise from extreme volatility events.
- On-Chart Calibration Guide: A persistent note on the chart provides simple instructions for adjusting the entropy threshold, making it easy for users to optimize the indicator’s performance.
Core Components
- Approximate Entropy (ApEn) Calculation: The core of the indicator, which measures the complexity or randomness of the price data.
- Zone Plotting: Creates visual boxes on the chart when the calculated ApEn value exceeds a user-defined threshold.
- Dynamic Zone Management: Manages the lifecycle of the zones, from creation to expiration, ensuring the chart remains uncluttered.
- Customizable Settings: A comprehensive set of inputs that allow users to control the indicator’s sensitivity, appearance, and time-based behavior.
Key Features
- Identifies Potential Reversals: The high-entropy zones can signal that a trend is nearing its end, giving traders an early warning.
- Works on Any Timeframe: The indicator can be applied to any chart timeframe, from minutes to days.
- Customizable Appearance: Users can change the color and transparency of the zones to match their chart’s theme.
- Informative Labels: Each zone can display the calculated entropy value and the direction of the candle on which it formed.
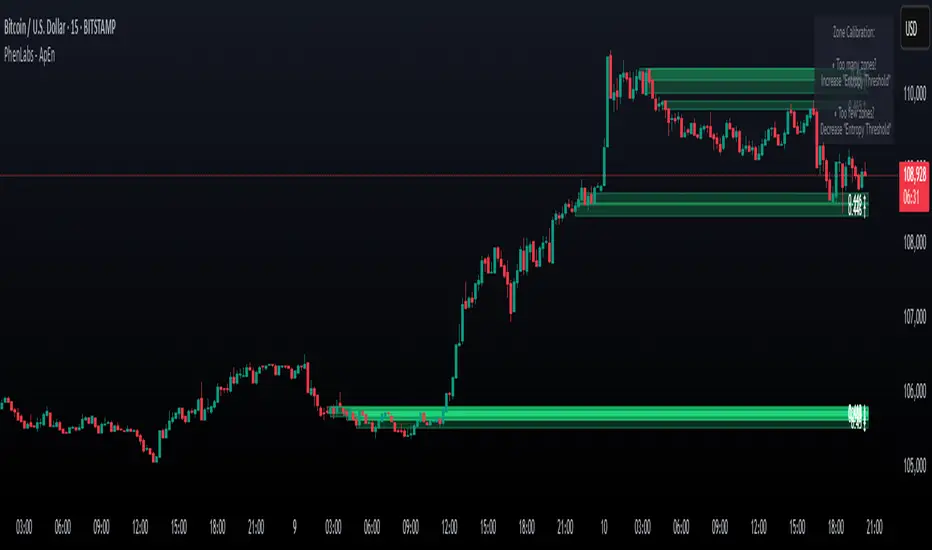
Visualization
- Entropy Zones: Shaded boxes that appear on the chart, highlighting candles with high complexity.
- Zone Labels: Text within each zone that displays the ApEn value and a directional arrow (e.g., “0.525 ↑”).
- Calibration Note: A small table in the top-right corner of the chart with instructions for adjusting the indicator’s sensitivity.
Usage Guidelines
Entropy Analysis
- Source: The price data used for the ApEn calculation. (Default: close)
- Lookback Length: The number of bars used in the ApEn calculation. (Default: 20, Range: 10-50)
- Embedding Dimension (m): The length of patterns to be compared; a standard value for financial data. (Default: 2)
- Tolerance Multiplier (r): Adjusts the tolerance for pattern matching; a larger value makes matching more lenient. (Default: 0.2)
- Entropy Threshold: The ApEn value that must be exceeded to plot a zone. Increase this if too many zones appear; decrease it if too few appear. (Default: 0.525)
Time Settings
- Analysis Timeframe: How long a zone remains on the chart after it forms. (Default: 1D)
- Custom Period (Bars): The zone’s lifespan in bars if “Analysis Timeframe” is set to “Custom”. (Default: 1000)
Zone Settings
- Zone Fill Color: The color of the entropy zones. (Default: #21f38a with 80% transparency)
- Maximum Zone Size %: Filters out zones on candles that are larger than this percentage of their low price. (Default: 0.5)
Display Options
- Show Entropy Label: Toggles the visibility of the text label inside each zone. (Default: true)
- Label Text Position: The horizontal alignment of the text label. (Default: Right)
- Show Calibration Note: Toggles the visibility of the calibration note in the corner of the chart. (Default: true)
Best Use Cases
- Trend Reversal Trading: Identifying when a strong trend is likely to reverse or pause.
- Breakout Confirmation: Using the absence of high entropy to confirm the strength of a breakout.
- Ranging Market Identification: Periods of high entropy can indicate that a market is transitioning into a sideways or choppy phase.
Limitations
- Not a Standalone Signal: This indicator should be used in conjunction with other forms of analysis to confirm trading signals.
- Lagging Nature: Like all indicators based on historical data, ApEn is a lagging measure and does not predict future price movements with certainty.
- Calibration Required: The effectiveness of the indicator is highly dependent on the “Entropy Threshold” setting, which needs to be adjusted for different assets and timeframes.
What Makes This Unique
- Quantifies Complexity: It provides a numerical measure of market complexity, offering a different perspective than traditional indicators.
- Clear Visual Cues: The zones make it easy to see when the market is in a state of high unpredictability.
- User-Friendly Design: With features like the on-chart calibration note, the indicator is designed to be easy to use and optimize.
How It Works
- Calculate Standard Deviation: The indicator first calculates the standard deviation of the source price data over a specified lookback period.
- Calculate Phi: It then calculates a value called “phi” for two different pattern lengths (embedding dimensions ‘m’ and ‘m+1’). This involves comparing sequences of data points to see how many are “similar” within a certain tolerance (determined by the standard deviation and the ‘r’ multiplier).
- Calculate ApEn: The Approximate Entropy is the difference between the two phi values. A higher ApEn value indicates greater irregularity and unpredictability in the data.
- Plot Zones: If the calculated ApEn exceeds the user-defined ‘Entropy Threshold’, a zone is plotted on the chart.
Note: The “Entropy Threshold” is the most important setting to adjust. If you see too many zones, increase the threshold. If you see too few, decrease it.
Open-source script
In true TradingView spirit, the creator of this script has made it open-source, so that traders can review and verify its functionality. Kudos to the author! While you can use it for free, remember that republishing the code is subject to our House Rules.
Smart Tools for Smarter Trades: phenlabs.com
Join our growing community: discord.gg/phen
All content provided by PhenLabs is for informational & educational purposes only. Past performance does not guarantee future results.
Join our growing community: discord.gg/phen
All content provided by PhenLabs is for informational & educational purposes only. Past performance does not guarantee future results.
Disclaimer
The information and publications are not meant to be, and do not constitute, financial, investment, trading, or other types of advice or recommendations supplied or endorsed by TradingView. Read more in the Terms of Use.