OPEN-SOURCE SCRIPT
VWAP Divergence | Flux Charts
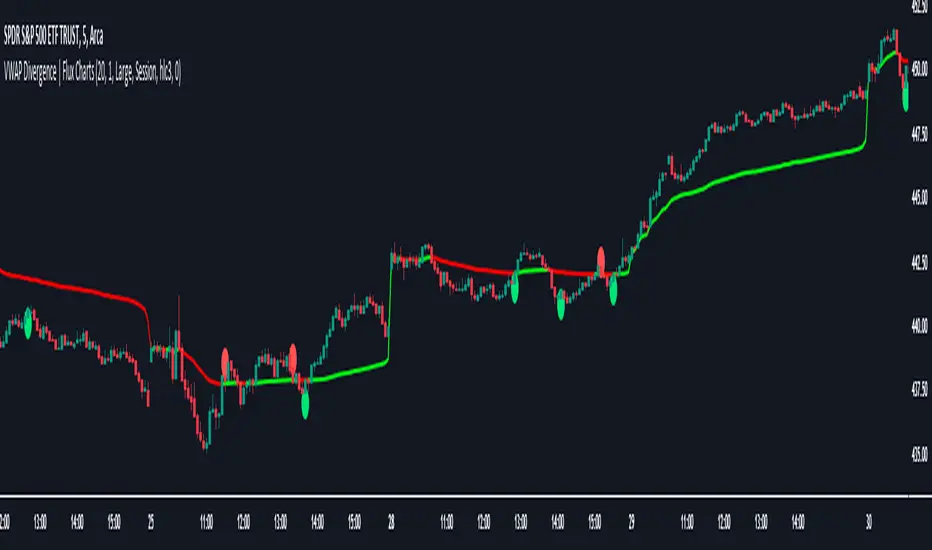
The VWAP Divergence indicator aims to find divergences between price action and the VWAP indicator. It uses filters to filter out many of the false divergences and alert high quality, accurate signals.

Red dots above the candle represent bearish divergences, while green dots below the candle represent bullish divergences.

The main filter for divergences focuses on ATR and the price movement in the past candles up to the lookback period. Divergences are determined when a price movement over the lookback period is sharp enough to be greater/less than the ATR multiplier multiplied by the ATR.
Settings
Under "Divergence Settings", both the lookback period and ATR multiplier can be adjusted.
Due to the nature of the calculations, the ATR multiplier and the lookback period should be set lower on higher time frames. As price movements become more averaged, for example on the 15 minute chart, sharp price movements happen less frequently and are often contained in fewer candles as they happen on lower time frames. Less volatile stocks such as KO, CL, or BAC should also use lower ATR multipliers and lower lookback periods.
Under "Visual Settings", you can change the color of the VWAP line, show alternating VWAP colors, adjust divergence signal size, and show the VWAP line.
Red dots above the candle represent bearish divergences, while green dots below the candle represent bullish divergences.
The main filter for divergences focuses on ATR and the price movement in the past candles up to the lookback period. Divergences are determined when a price movement over the lookback period is sharp enough to be greater/less than the ATR multiplier multiplied by the ATR.
Settings
Under "Divergence Settings", both the lookback period and ATR multiplier can be adjusted.
Due to the nature of the calculations, the ATR multiplier and the lookback period should be set lower on higher time frames. As price movements become more averaged, for example on the 15 minute chart, sharp price movements happen less frequently and are often contained in fewer candles as they happen on lower time frames. Less volatile stocks such as KO, CL, or BAC should also use lower ATR multipliers and lower lookback periods.
Under "Visual Settings", you can change the color of the VWAP line, show alternating VWAP colors, adjust divergence signal size, and show the VWAP line.
Open-source script
In true TradingView spirit, the creator of this script has made it open-source, so that traders can review and verify its functionality. Kudos to the author! While you can use it for free, remember that republishing the code is subject to our House Rules.
Access Flux Charts' exclusive indicators: fluxcharts.com/
Join our Discord community: discord.gg/FluxCharts
Join our Discord community: discord.gg/FluxCharts
Disclaimer
The information and publications are not meant to be, and do not constitute, financial, investment, trading, or other types of advice or recommendations supplied or endorsed by TradingView. Read more in the Terms of Use.