OPEN-SOURCE SCRIPT
Updated High - Low Trend Tunnel
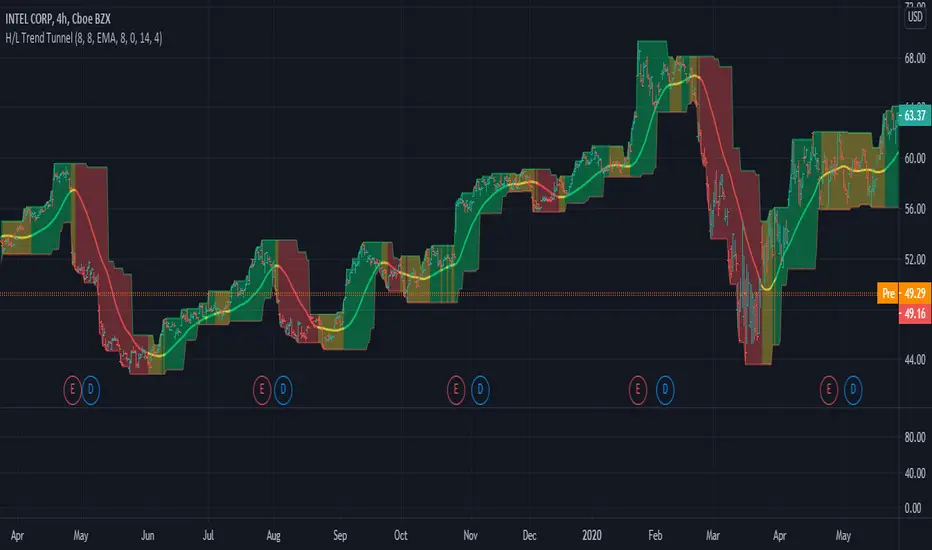
High - Low Trend Tunnel Experiment.
Using latest pinescript Array support!
Plotting Highest highs and Lowest lows for specific length (can be defined in settings).
The blue line is whom determinate the direction.
Blue line is the average of the highest highs and lowest lows smoothed by EMA.
Green - Up Trending.
Red - Down Trending.
Yellow - Squeeze, a reversal might be coming.
Any suggestions/comments are welcome as this is an experiment.
Release Notes
* Trend plot is now colored.* Changed ATR default value from 17 to 14
Release Notes
Option to disable view of tunnel.Added additional (optional) Arnaud Legoux Moving Average (ALMA) besides EMA.
Release Notes
Minor cleanupOpen-source script
In true TradingView spirit, the creator of this script has made it open-source, so that traders can review and verify its functionality. Kudos to the author! While you can use it for free, remember that republishing the code is subject to our House Rules.
Appreciation of my work: paypal.me/dman103
All Premium indicators: algo.win
LIVE Stream - Pivot Points Algo: youtube.com/channel/UCFyqab-i0xb2jf-c18ufH0A/live
All Premium indicators: algo.win
LIVE Stream - Pivot Points Algo: youtube.com/channel/UCFyqab-i0xb2jf-c18ufH0A/live
Disclaimer
The information and publications are not meant to be, and do not constitute, financial, investment, trading, or other types of advice or recommendations supplied or endorsed by TradingView. Read more in the Terms of Use.
Open-source script
In true TradingView spirit, the creator of this script has made it open-source, so that traders can review and verify its functionality. Kudos to the author! While you can use it for free, remember that republishing the code is subject to our House Rules.
Appreciation of my work: paypal.me/dman103
All Premium indicators: algo.win
LIVE Stream - Pivot Points Algo: youtube.com/channel/UCFyqab-i0xb2jf-c18ufH0A/live
All Premium indicators: algo.win
LIVE Stream - Pivot Points Algo: youtube.com/channel/UCFyqab-i0xb2jf-c18ufH0A/live
Disclaimer
The information and publications are not meant to be, and do not constitute, financial, investment, trading, or other types of advice or recommendations supplied or endorsed by TradingView. Read more in the Terms of Use.