OPEN-SOURCE SCRIPT
Updated Magnum Pivots
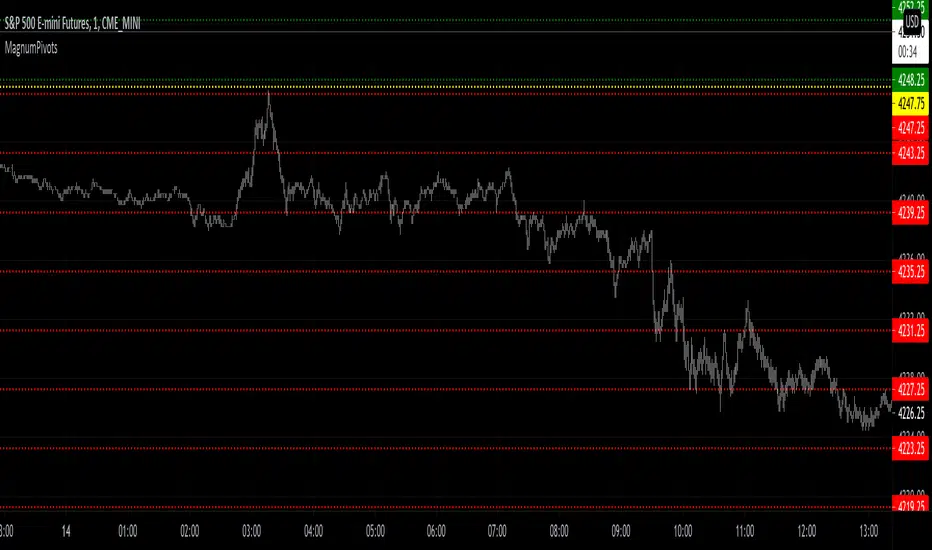
This script will automatically plot levels for ES and the NQ, which this script is ONLY meant for. It will take the overnight highs and lows, from 6pm to 6am EST, and subtract/add 110 for NQ and 33 for ES, add a middle line that is the average of those two lines, and then deviations inbetween, built in support for up to 7, of deviation lines (13.75 point difference for each value on the NQ, and 4 for the ES). This lines become support/resistance depending on price action.
Release Notes
Added some comments, be sure to set your chart to "scale to price only"Open-source script
In true TradingView spirit, the creator of this script has made it open-source, so that traders can review and verify its functionality. Kudos to the author! While you can use it for free, remember that republishing the code is subject to our House Rules.
Disclaimer
The information and publications are not meant to be, and do not constitute, financial, investment, trading, or other types of advice or recommendations supplied or endorsed by TradingView. Read more in the Terms of Use.
Open-source script
In true TradingView spirit, the creator of this script has made it open-source, so that traders can review and verify its functionality. Kudos to the author! While you can use it for free, remember that republishing the code is subject to our House Rules.
Disclaimer
The information and publications are not meant to be, and do not constitute, financial, investment, trading, or other types of advice or recommendations supplied or endorsed by TradingView. Read more in the Terms of Use.