OPEN-SOURCE SCRIPT
Kill Zone Max Volume Candle Lines
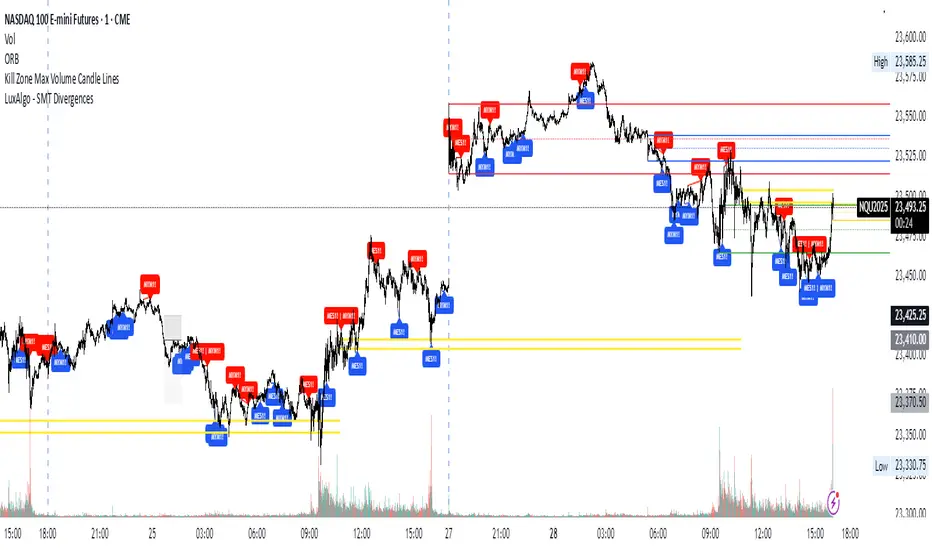
The Kill Zone Max Volume Lines indicator identifies the highest-volume candle within four key market sessions (Asia, London, NY AM, NY PM) and plots horizontal lines at its high, low, and midpoint levels, extended to the right.
Designed for traders targeting zones of heightened activity, this indicator highlights dynamic support and resistance levels based on volume—ideal for breakout or bounce strategies during highly volatile periods known as “kill zones.”
Perfect for indices such as Nasdaq (NQ), S&P 500 (SP), and Dow Jones (YM) on 15-minute or higher timeframes.
Open-source script
In true TradingView spirit, the creator of this script has made it open-source, so that traders can review and verify its functionality. Kudos to the author! While you can use it for free, remember that republishing the code is subject to our House Rules.
Disclaimer
The information and publications are not meant to be, and do not constitute, financial, investment, trading, or other types of advice or recommendations supplied or endorsed by TradingView. Read more in the Terms of Use.