OPEN-SOURCE SCRIPT
Updated Support and Resistance
what is "Support and Resistance"?
it is a support and resistance indicator.
what it does?
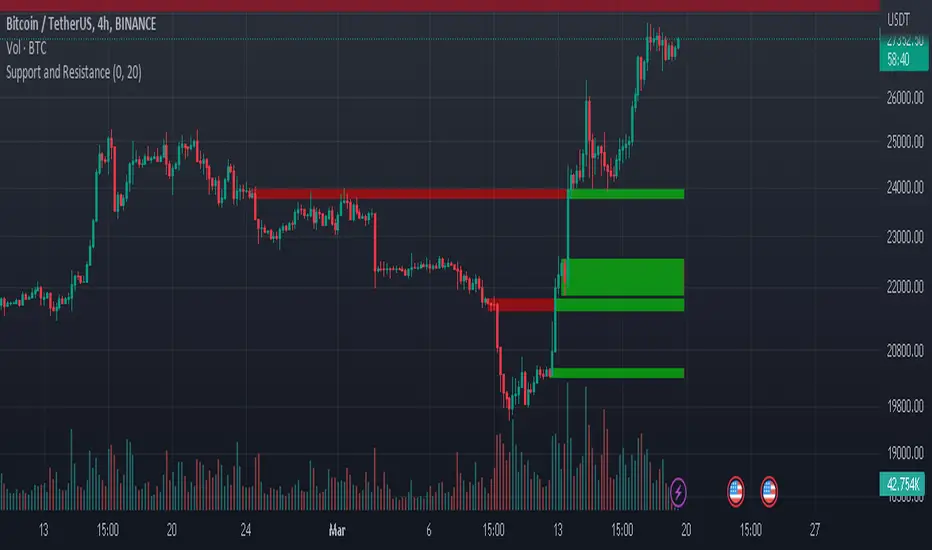
it draw support and resistance zones on the chart.
how it does it?
It determines the zones where the price leaves with a big candle after going horizontal for a while as support or resistance zones according to the price movement direction. while doing this, it compares the size of the candles and the elapsed time.
how to use it?
Red zones represent resistance and green zones represent support. You can buy in the support zone or sell in the resistance zone. my advice is to make your own interpretation by taking into account the price movement with different indicators. they are considered useful if there is a closure beyond the zones. otherwise, they continue to be shifted to the right.
notice: As new zones are created, old ones may disappear. so it might be wise to draw boxes using drawing tools where the old zones are.
Support and resistance are very important concepts for technical analysis. so I am thinking of updating and improving this indicator many times in the long run. but I couldn't wait long to post it.
examples:


it is a support and resistance indicator.
what it does?
it draw support and resistance zones on the chart.
how it does it?
It determines the zones where the price leaves with a big candle after going horizontal for a while as support or resistance zones according to the price movement direction. while doing this, it compares the size of the candles and the elapsed time.
how to use it?
Red zones represent resistance and green zones represent support. You can buy in the support zone or sell in the resistance zone. my advice is to make your own interpretation by taking into account the price movement with different indicators. they are considered useful if there is a closure beyond the zones. otherwise, they continue to be shifted to the right.
notice: As new zones are created, old ones may disappear. so it might be wise to draw boxes using drawing tools where the old zones are.
Support and resistance are very important concepts for technical analysis. so I am thinking of updating and improving this indicator many times in the long run. but I couldn't wait long to post it.
examples:
Release Notes
added input to change transp.added 4 extra zones (2 buy and 2 sell).
Release Notes
breaker blocks added.https://ghosttraders1203.b-cdn.net/wp-content/uploads/2022/04/breaker.png
Release Notes
The indicator has become more efficient so you will no longer get an error when new bars are added.second important change: you will now be able to see the previous signals by changing the inputs in the settings section
Release Notes
Minor changes.Release Notes
color option added.Open-source script
In true TradingView spirit, the creator of this script has made it open-source, so that traders can review and verify its functionality. Kudos to the author! While you can use it for free, remember that republishing the code is subject to our House Rules.
Disclaimer
The information and publications are not meant to be, and do not constitute, financial, investment, trading, or other types of advice or recommendations supplied or endorsed by TradingView. Read more in the Terms of Use.
Open-source script
In true TradingView spirit, the creator of this script has made it open-source, so that traders can review and verify its functionality. Kudos to the author! While you can use it for free, remember that republishing the code is subject to our House Rules.
Disclaimer
The information and publications are not meant to be, and do not constitute, financial, investment, trading, or other types of advice or recommendations supplied or endorsed by TradingView. Read more in the Terms of Use.