OPEN-SOURCE SCRIPT
MACD Modified
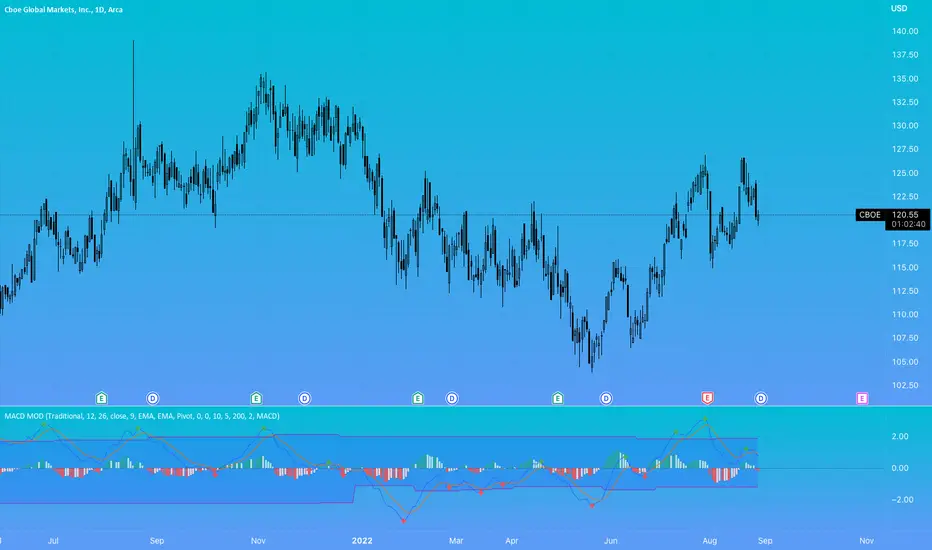
In an attempt to improve the MACD for trading, I have added an alternative way to calculate the MACD Line and Overbought/Oversold (OB/OS) lines to filter signals.
The alternate calculation I named "Modified" and put the option to select it under "MACD Calculation" in the input menu. Traditionally the MACD is calculated as fastEMA - slowEMA, for "Modified" I changed the calculation to ((fastEMA - slowEMA) / slowEMA * 100). The goal of this change is to view the difference in MA as a percent of the slow. The hope is that this will compensate for securities that have had major gains or losses in their history.
For the OB/OS lines, I coded in three different ways to calculate them. Users can select which method they prefer in the input menu. The first is through pivot points. The script records the pivot points into an array and takes the average of the array. There are two arrays, one for the OB line and one for the OS line. I also added filters so it will only record pivots above/below a specific value. The crosses on the indicator are for debugging purposes only. They mark the pivots that were recorded into the arrays. The crosses are offset by the pivot strength and do not provide timely indications. All inputs are adjustable for the pivots in the "Pivots" section of the input menu. The second method for the OB/OS lines I added is Bollinger Bands. The user can choose to put it around the Signal or MACD line. The final method added is simply using the previous high/low pivot of the MACD line.
Open-source script
In true TradingView spirit, the creator of this script has made it open-source, so that traders can review and verify its functionality. Kudos to the author! While you can use it for free, remember that republishing the code is subject to our House Rules.
Checkout my free weekly market updates on substack!
ronaldryninger.substack.com
ronaldryninger.substack.com
Disclaimer
The information and publications are not meant to be, and do not constitute, financial, investment, trading, or other types of advice or recommendations supplied or endorsed by TradingView. Read more in the Terms of Use.