OPEN-SOURCE SCRIPT
HR from Prev close
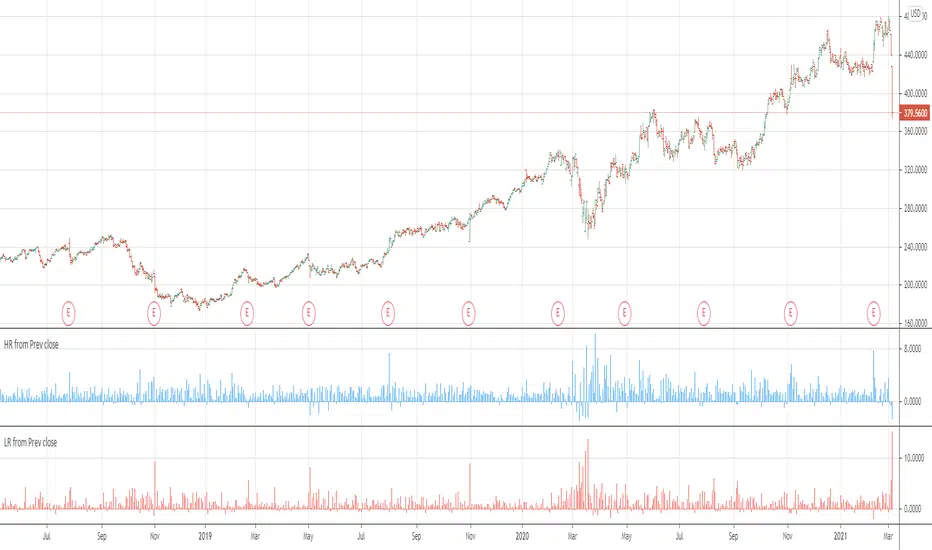
This is my simple indicator to help identify whether an upside bar is unusual or not. I like to see a bar as particularly unusual like a 15% move in a long period where a typical move is under 5%. It usually signals a buying climax and the end of that short term rally.
I compares the previous bar's close to the current bar's high and is expressed as a percentage.
I am not much of an expert in pine so I did not program it to plot as a histogram but that is how I like to view it. If you know how, by all means, send me the edit and I will credit you.
I compares the previous bar's close to the current bar's high and is expressed as a percentage.
I am not much of an expert in pine so I did not program it to plot as a histogram but that is how I like to view it. If you know how, by all means, send me the edit and I will credit you.
Open-source script
In true TradingView spirit, the creator of this script has made it open-source, so that traders can review and verify its functionality. Kudos to the author! While you can use it for free, remember that republishing the code is subject to our House Rules.
Disclaimer
The information and publications are not meant to be, and do not constitute, financial, investment, trading, or other types of advice or recommendations supplied or endorsed by TradingView. Read more in the Terms of Use.