OPEN-SOURCE SCRIPT
Previous VWAP Levels by Riotwolftrading
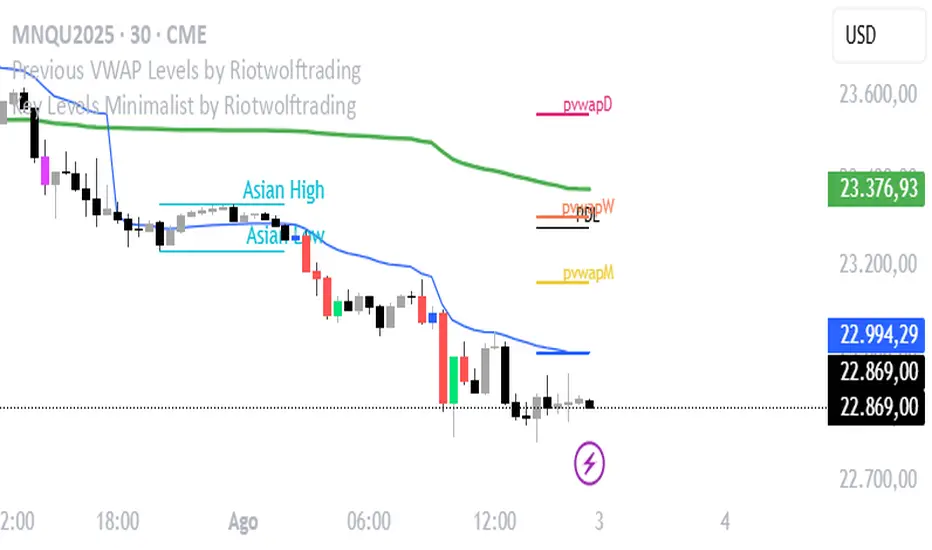
The "Previous VWAP" indicator calculates and displays the previous session's Volume Weighted Average Price (VWAP) for five timeframes (Daily, Weekly, Monthly, Quarterly, Yearly).
Each VWAP is plotted as a horizontal line extending to the right edge of the chart, with customizable labels at the right to identify each level. The indicator is designed for traders who want to visualize key price levels from prior periods without cluttering the chart with current VWAPs or additional metrics like standard deviations.
**Functionality**:
- **Calculates Previous VWAPs**: Computes the VWAP for the previous session of each timeframe (Daily, Weekly, Monthly, Quarterly, Yearly) based on the input source (default: `hlc3`) and volume.
- **Visual Style**: Uses `line.new` to draw horizontal lines from five bars back to the current bar, ensuring the lines extend to the right edge of the chart. Labels are placed at the right edge using `label.new` for clear identification.
- **Customization**: Allows users to toggle visibility, adjust line styles, widths, colors, and label sizes, and choose between abbreviated or full label text.
- **Minimalist Design**: Focuses solely on previous VWAPs, omitting current VWAPs, rolling VWAPs, and standard deviation bands to keep the chart clean.
**Intended Use**: This indicator is useful for traders who rely on historical VWAP levels as support/resistance or reference points for trading decisions, particularly in strategies involving mean reversion or breakout trading.
---
### Rules and Features
*VWAP Calculation**:
- The VWAP is calculated as the cumulative sum of price (`src`) multiplied by volume (`sumSrcVol`) divided by the cumulative volume (`sumVol`) for each timeframe.
- The "previous VWAP" is the VWAP value from the prior session, captured when a new session begins (e.g., new day, week, month, etc.).
- The indicator uses the `hlc3` (average of high, low, close) as the default source, but users can modify this in the settings.
**Timeframes**:
- **Daily**: Previous day's VWAP.
- **Weekly**: Previous week's VWAP.
- **Monthly**: Previous month's VWAP.
- **Quarterly**: Previous quarter's VWAP (3 months).
- **Yearly**: Previous year's VWAP (12 months).
- New sessions are detected using `ta.change(time(period))` for each timeframe.
**Line Drawing**:
- Lines are drawn using `line.new` from `time[5]` (five bars back) to the current bar (`time`), ensuring they extend to the right edge of the chart.
- Lines are updated only on the last confirmed bar (`barstate.islast`) to optimize performance and avoid repainting.
- Previous lines are deleted (`line.delete`) to prevent overlapping or clutter.
**Labels**:
- Labels are drawn at the right edge (`x=time`, `xloc=xloc.bar_time`) with `label.new`.
- Users can choose between abbreviated labels (e.g., "pvD" for Previous Daily VWAP) or full labels (e.g., "Prev Daily VWAP").
- Label sizes are customizable (`tiny`, `small`, `normal`, `large`, `huge`).
- Labels are deleted (`label.delete`) on each update to maintain a clean chart.
5. **Customization Options**:
- **Visibility**: Toggle each VWAP (Daily, Weekly, Monthly, Quarterly, Yearly) on or off.
- **Colors**: Individual color settings for each VWAP line and label (default colors: Daily=#E12D7B, Weekly=#F67B52, Monthly=#EDCD3B, Quarterly=#3BBC54, Yearly=#2665BD).
- **Line Style**: Choose from `solid`, `dotted`, or `dashed` lines.
- **Line Width**: Adjustable from 1 to 4 pixels.
- **Label Settings**: Enable/disable labels, abbreviate text, and select label size.
- **Source**: Customize the price source (default: `hlc3`).
**Performance Optimization**:
- The indicator only updates lines and labels on the last confirmed bar to minimize computational overhead.
- Uses `var` to initialize variables and avoid unnecessary recalculations.
- Deletes previous lines and labels to prevent chart clutter.
---
### Usage Instructions
1. **Add to Chart**:
- In TradingView, go to the Pine Editor, paste the script, and click "Add to Chart."
- The indicator will overlay on the price chart, showing previous VWAP lines and labels.
2. **Configure Settings**:
- Open the indicator settings to customize:
- Toggle visibility of each VWAP timeframe.
- Adjust colors, line style, and width.
- Enable/disable labels, choose abbreviation, and set label size.
- Modify the source if needed (e.g., use `close` instead of `hlc3`).
3. **Interpretation**:
- **Previous VWAPs**: Act as dynamic support/resistance levels based on the prior session's volume-weighted price.
- **Timeframes**: Use shorter timeframes (Daily, Weekly) for intraday/swing trading, and longer timeframes (Monthly, Quarterly, Yearly) for positional trading.
- **Labels**: Identify each VWAP level at the right edge of the chart for quick reference.
4. **Best Practices**:
- Use on charts with sufficient volume data, as VWAP relies on volume (a warning is triggered if no volume data is available).
- Combine with other indicators (e.g., moving averages, RSI) for confirmation in trading strategies.
- Adjust line styles and colors to avoid visual overlap with other chart elements.
---
### Example Use Case
A trader using a 1-hour chart can add the "Previous VWAP" indicator to identify key levels from the prior day, week, or month. For example:
- The Previous Daily VWAP might act as a support level for a bullish trend.
- The Previous Weekly VWAP could serve as a target for a swing trade.
- Labels at the right edge make it easy to identify these levels without cluttering the chart.
This indicator provides a clean, customizable way to visualize previous VWAPs, making it ideal for traders who want historical price context with minimal chart noise. For the complete Pine Script code, refer to the artifact provided in the previous response.
Open-source script
In true TradingView spirit, the creator of this script has made it open-source, so that traders can review and verify its functionality. Kudos to the author! While you can use it for free, remember that republishing the code is subject to our House Rules.
Disclaimer
The information and publications are not meant to be, and do not constitute, financial, investment, trading, or other types of advice or recommendations supplied or endorsed by TradingView. Read more in the Terms of Use.