OPEN-SOURCE SCRIPT
HOG QQE Candles
HOG QQE Candles
📊 Overview
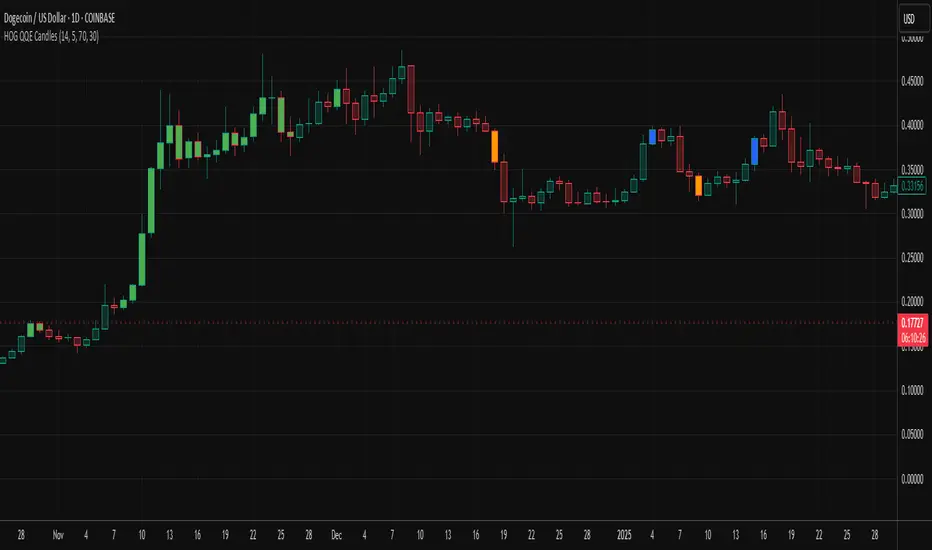
A lightweight overlay that visually reflects RSI/QQE dynamics through color-coded candles. Designed for traders who want quick insight into momentum shifts — without opening a separate oscillator panel.
⚙️ How It Works
• Calculates smoothed RSI using QQE-style EMA
• Colors candles green for Overbought (OB), red for Oversold (OS)
• Colors candles blue on midline cross up (bullish), orange on cross down (bearish)
• OB/OS levels and midline signals are fully configurable
• Optional toggle for highlighting midline crosses
🎯 Inputs
• RSI Length
• QQE Smoothing
• Overbought / Oversold Levels
• Toggle: Show Midline Cross Highlights
• Toggle: Color OB/OS Candles
✅ Benefits
• No subwindow clutter — signals directly on price
• Clear OB/OS candles help identify exhaustion
• Midline color shifts reveal fresh momentum early
• Makes RSI/QQE readable at a glance
• Works great as a visual enhancer for trend or volume-based systems
📈 Use Cases
• Spot trend exhaustion during strong moves
• Confirm entry/exit with RSI midline cross
• Layer with trend overlays (e.g., EMAs, Supertrend)
• Ideal for minimal or clean chart setups
⚠️ Notes
• Candle color precedence: Midline cross > OB/OS
• Signal strength varies by timeframe and asset
• Best used as a visual companion, not standalone entry trigger
📊 Overview
A lightweight overlay that visually reflects RSI/QQE dynamics through color-coded candles. Designed for traders who want quick insight into momentum shifts — without opening a separate oscillator panel.
⚙️ How It Works
• Calculates smoothed RSI using QQE-style EMA
• Colors candles green for Overbought (OB), red for Oversold (OS)
• Colors candles blue on midline cross up (bullish), orange on cross down (bearish)
• OB/OS levels and midline signals are fully configurable
• Optional toggle for highlighting midline crosses
🎯 Inputs
• RSI Length
• QQE Smoothing
• Overbought / Oversold Levels
• Toggle: Show Midline Cross Highlights
• Toggle: Color OB/OS Candles
✅ Benefits
• No subwindow clutter — signals directly on price
• Clear OB/OS candles help identify exhaustion
• Midline color shifts reveal fresh momentum early
• Makes RSI/QQE readable at a glance
• Works great as a visual enhancer for trend or volume-based systems
📈 Use Cases
• Spot trend exhaustion during strong moves
• Confirm entry/exit with RSI midline cross
• Layer with trend overlays (e.g., EMAs, Supertrend)
• Ideal for minimal or clean chart setups
⚠️ Notes
• Candle color precedence: Midline cross > OB/OS
• Signal strength varies by timeframe and asset
• Best used as a visual companion, not standalone entry trigger
Open-source script
In true TradingView spirit, the creator of this script has made it open-source, so that traders can review and verify its functionality. Kudos to the author! While you can use it for free, remember that republishing the code is subject to our House Rules.
Disclaimer
The information and publications are not meant to be, and do not constitute, financial, investment, trading, or other types of advice or recommendations supplied or endorsed by TradingView. Read more in the Terms of Use.