OPEN-SOURCE SCRIPT
ES1! vs ZB1! Exponentially Weighted Correlation
ES1! vs ZB1! Exponentially Weighted Correlation
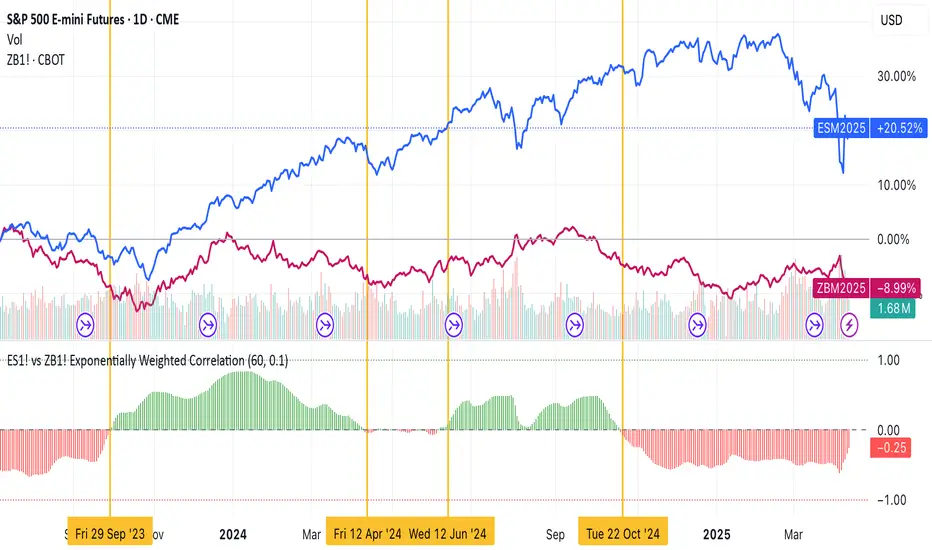
This indicator calculates and visualizes the exponentially weighted correlation between the S&P 500 E-mini futures (ES1!) and the 30-Year U.S. Treasury Bond futures (ZB1!) over a user-defined lookback period. By using an exponential moving average (EMA) approach, it emphasizes recent price movements, providing a dynamic view of the relationship between these two key financial instruments.
Features:
- Customizable Inputs: Adjust the lookback length (default: 60) and alpha (default: 0.1) to fine-tune the sensitivity of the correlation calculation.
- Exponentially Weighted Correlation: Measures the strength and direction of the relationship between ES1! and ZB1! prices, with more weight given to recent data.
- Visual Clarity: Displays correlation as colored bars (green for positive, red for negative) for quick interpretation, with reference lines at 0, +1, and -1 for context.
- Non-Overlay Design: Plotted in a separate panel below the chart to avoid cluttering price data.
How It Works:
The indicator fetches closing prices for ES1! and ZB1!, applies an EMA to smooth the data, and computes the exponentially weighted covariance and variances. The correlation is then derived and plotted as a histogram, helping traders identify whether the two markets are moving together (positive correlation), in opposite directions (negative correlation), or independently.
Use Cases:
- Market Analysis: Gauge the relationship between equity and bond markets to inform trading strategies.
- Risk Management: Monitor correlation shifts to adjust portfolio exposure.
- Intermarket Insights: Identify trends or divergences in the stock-bond dynamic for macroeconomic analysis.
Ideal for traders and analysts tracking intermarket relationships, this indicator offers a clear, responsive tool for understanding ES1! and ZB1! correlation in real-time.
Open-source script
In true TradingView spirit, the creator of this script has made it open-source, so that traders can review and verify its functionality. Kudos to the author! While you can use it for free, remember that republishing the code is subject to our House Rules.
Disclaimer
The information and publications are not meant to be, and do not constitute, financial, investment, trading, or other types of advice or recommendations supplied or endorsed by TradingView. Read more in the Terms of Use.