OPEN-SOURCE SCRIPT
PHL Sweep Signals(1 Hour)
PHL Sweep Signals (Full History)
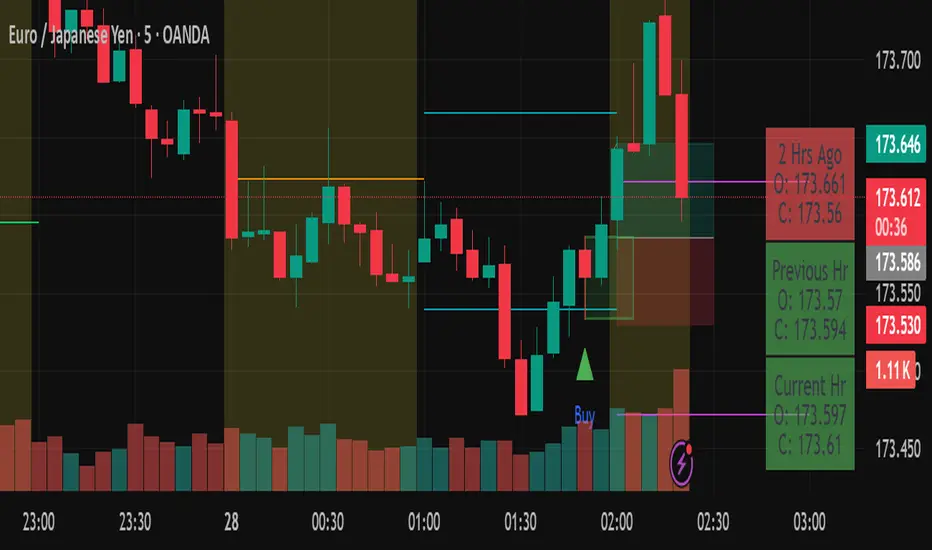
This indicator is designed to identify high-probability reversal setups by detecting liquidity sweeps of the previous standard hour's high and low (PHL). It provides clear, actionable signals complete with visual aids and a data table to keep you in tune with the higher-timeframe context.
Key Features
Previous Hour Levels: Automatically draws the high and low of the previous standard hour as key reference lines for the current trading hour. The line colors rotate to provide a clear visual separation.
Bearish Sweep Signal: Identifies a specific bearish pattern: a green (bullish) candle that wicks above the previous hour's high but fails to hold, with its body remaining entirely below the line.
Bullish Sweep Signal: Identifies the opposite bullish pattern: a red (bearish) candle that wicks below the previous hour's low but is absorbed, with its body remaining entirely above the line.
Clear Visual Signals: When a signal is confirmed, the indicator provides a multi-faceted alert:
Plots a "Buy" or "Sell" arrow on the chart.
Draws a colored box around the signal candle for easy identification.
Displays a label with the potential Stop Loss size (calculated from the size of the signal candle).
Informative Display Table: Includes a convenient table in the corner showing the Open and Close data for the last 3 hours, helping you stay aware of the broader market context without leaving your chart.
Built-in Alerts: Triggers an alert for every confirmed Buy and Sell signal so you never miss a potential setup.
How to Use
This indicator helps you spot potential exhaustion and reversals at key hourly levels.
A "Sell" signal suggests a failed breakout to the upside, indicating potential weakness and a possible entry for shorts.
A "Buy" signal suggests a failed breakdown to the downside, indicating potential strength and a possible entry for longs.
As with any tool, these signals are most powerful when used as part of a comprehensive trading strategy and combined with your own analysis for confirmation.
Optimal Settings:
Timeframe: 5-Minute
Time Zone: UTC-4 (New York Time)
-ratheeshinv
Open-source script
In true TradingView spirit, the creator of this script has made it open-source, so that traders can review and verify its functionality. Kudos to the author! While you can use it for free, remember that republishing the code is subject to our House Rules.
Disclaimer
The information and publications are not meant to be, and do not constitute, financial, investment, trading, or other types of advice or recommendations supplied or endorsed by TradingView. Read more in the Terms of Use.