OPEN-SOURCE SCRIPT
Updated WaveTrend [LazyBear] vX by DGT
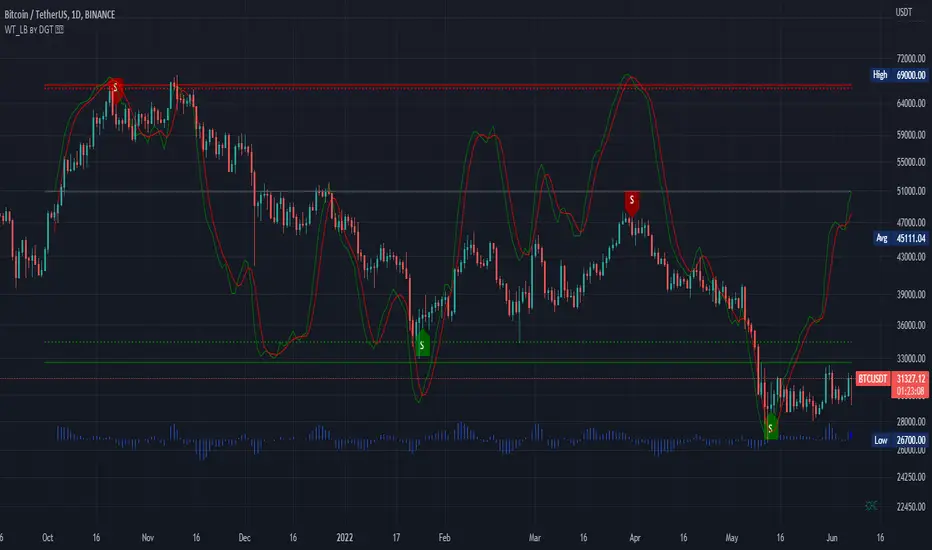
DGT interpreted version of LazyBear's WaveTrend, visualizing on Price Chart
Original Author : LazyBear
Crosses above or below threshold are emphasized with bigger labels
- crosses above threshold : probable short indications with a bigger label and relativly small label for probable long indications
- crosses below threshold : probable long indications with a bigger label and relativly small label for probable short indications
All rest crosses within threshold boundaries with relatively small labels for both long and short probable indications
Release Notes
small update : alert condition addedRelease Notes
update thanks to sandyrindal suggestions, special thanks to himadded ability to change the signal length
added ability to compare with other symbols, can be symbols that are directly correlated or inversely correlated symbols
Here is the modified code for the ones who enjoy the WaveTrend Oscillator on separate pane
//@version=4
//@author LazyBear, modified by dgtrd
study(title="WaveTrend [LazyBear]", shorttitle="WT_LB vX ʙʏ DGT ☼☾")
n1 = input(10, "Length : Channel ", inline = "LEN")
n2 = input(21, "Average", inline = "LEN")
s1 = input(4 , "Signal Length")
obLevel1 = input( 60, "Over Bought Level 1", inline = "OB")
obLevel2 = input( 53, "Level 2" , inline = "OB")
osLevel1 = input(-60, "Over Sold Level 1" , inline = "OS")
osLevel2 = input(-53, "Level 2" , inline = "OS")
f_getWT(s) =>
ap = s
esa = ema(ap, n1)
d = ema(abs(ap - esa), n1)
ci = (ap - esa) / (0.015 * d)
tci = ema(ci, n2)
wt1 = tci
wt2 = sma(wt1, s1)
[wt1, wt2]
plot(0 , color=color.gray )
plot(obLevel1, color=color.red )
plot(osLevel1, color=color.green)
plot(obLevel2, color=color.red , style=3)
plot(osLevel2, color=color.green, style=3)
[wt1, wt2] = f_getWT(hlc3)
plot(wt1 , color=color.green)
plot(wt2 , color=color.red , style=3)
plot(wt1-wt2, color=color.blue , style=plot.style_area, transp=80)
compare = input(false, "Compare with Symbol", inline = "CPR")
symbol = input("CBOE:VIX" , "", type=input.symbol, inline = "CPR")
extSrc = security (symbol , timeframe.period, hlc3, barmerge.gaps_off, barmerge.lookahead_on)
[wt1x, wt2x] = f_getWT(extSrc)
plot(compare ? wt1x : na, color=color.aqua)
plot(compare ? wt2x : na, color=color.yellow, style=3)
plot(compare ? wt1x-wt2x : na, color=color.olive, style=plot.style_area, transp=80)
Release Notes
added a label to display current values of the wavetrend and signal level Release Notes
Update* overlay wavetrand display addition, better interpretation
* enhanced signal customizations
Similar Indicators
Oscillators Overlay w/ Divergencies/Alerts : Oscillators-Overlay-with-Divergencies-Alerts
Elliott Wave Oscillator Signals : EWO-Signals
Open-source script
In true TradingView spirit, the creator of this script has made it open-source, so that traders can review and verify its functionality. Kudos to the author! While you can use it for free, remember that republishing the code is subject to our House Rules.
Our Premium Indicators: sites.google.com/view/solemare-analytics
Disclaimer
The information and publications are not meant to be, and do not constitute, financial, investment, trading, or other types of advice or recommendations supplied or endorsed by TradingView. Read more in the Terms of Use.