OPEN-SOURCE SCRIPT
Updated Multi-Timeframe High/Low Marker
Description
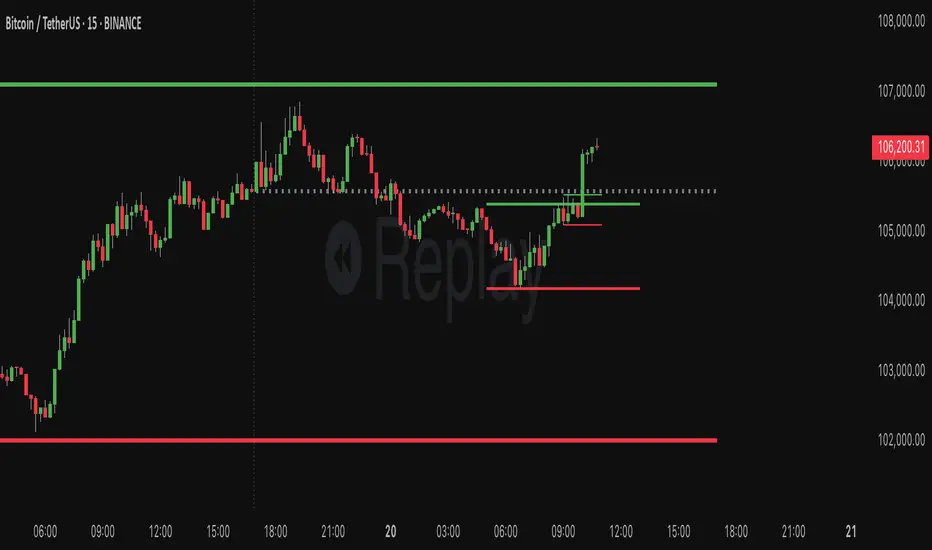
This indicator displays the previous period's high and low price levels from up to three different timeframes simultaneously. Lines extend from the previous period through the current period, providing clear visual reference points for key price levels across multiple time horizons.
Utility
Identify price ranges and key levels from multiple periods.Reduce chart switching by displaying multiple ranges on a single chart.
Function
- Track up to 3 different timeframes simultaneously (default: 1H, 4H, Daily)
- Customize each timeframe's high and low line colors, width, and style (solid/dashed/dotted)
- Optional current period opening price display for each timeframe
- Smart overlap detection prevents duplicate lines when multiple timeframes share the same price level
- Each timeframe can be individually enabled or disabled
- All visual elements fully customizable through indicator settings
Release Notes
DescriptionThis indicator displays the previous period's high and low price levels from up to three different timeframes simultaneously. Lines extend from the previous period through the current period, providing clear visual reference points for key price levels across multiple time horizons.
Utility
This is a simple but powerful indicator which will automatically draw significant price levels on timeframes of your selection:
- Identify price ranges and key levels from multiple periods
- Reduce chart switching by displaying multiple ranges on a single chart
- Visualize where current price sits relative to significant historical levels
- Understand market structure by seeing how different timeframe ranges interact
- Plan trades using confluence of levels from multiple timeframes
- Track price action relative to opening prices across different periods
Function - Track up to 3 different timeframes simultaneously (default: 1H, 4H, Daily)
- Customize each timeframe's high and low line colors, width, and style (solid/dashed/dotted)
- Optional current period opening price display for each timeframe
- Smart overlap detection prevents duplicate lines when multiple timeframes share the same price level
- Each timeframe can be individually enabled or disabled
- Optional price labels at line ends for quick reference
- Automatic cleanup of old lines as new periods begin
- Only displays on appropriate timeframes (e.g., daily levels hidden on daily+ charts)
- All visual elements fully customizable through indicator settings
Release Notes
Fixes an issue where some timeframes could not be drawn on the current timeframe shown.Release Notes
- Fixed an issue where daily levels would not display properly on equities (e.g. SPY) by using time-based coordinates instead of bar calculations
- Resolved errors when using weekly/monthly timeframes
- Updated overlap detection to apply to opening prices, and removed 5-tick threshold (now only exact price levels are considered overlapping)
Open-source script
In true TradingView spirit, the creator of this script has made it open-source, so that traders can review and verify its functionality. Kudos to the author! While you can use it for free, remember that republishing the code is subject to our House Rules.
Disclaimer
The information and publications are not meant to be, and do not constitute, financial, investment, trading, or other types of advice or recommendations supplied or endorsed by TradingView. Read more in the Terms of Use.