OPEN-SOURCE SCRIPT
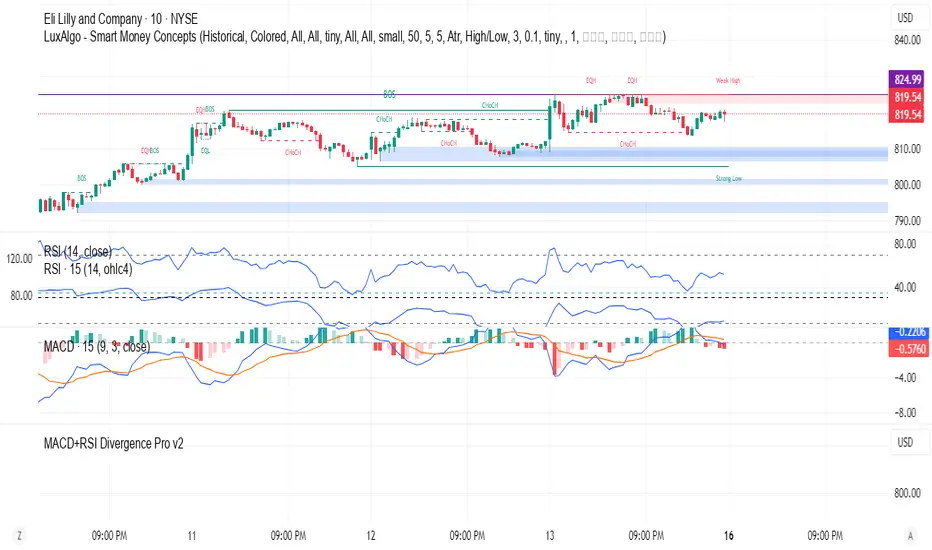
MACD+RSI Divergence Pro v2
//version=5
indicator("MACD+RSI Divergence Pro v2", overlay=true)
// 1. إعداد MACD
[macdLine, signalLine, _] = ta.macd(close, 12, 26, 9)
macdBullish = ta.crossover(macdLine, signalLine)
macdBearish = ta.crossunder(macdLine, signalLine)
// 2. إعداد RSI
rsiValue = ta.rsi(close, 14)
rsiOverbought = rsiValue >= 70
rsiOversold = rsiValue <= 30
// 3. كشف الاختلافات المصحح
// → استخدمنا الدالة `ta.valuewhen()` لتحديد القمم/القيعان بدقة
swingLow = ta.lowest(low, 5)
swingHigh = ta.highest(high, 5)
rsiAtSwingLow = ta.valuewhen(swingLow == low, rsiValue, 0)
rsiAtSwingHigh = ta.valuewhen(swingHigh == high, rsiValue, 0)
bullishDiv = low < low[1] and rsiAtSwingLow > rsiAtSwingLow[1] and rsiOversold
bearishDiv = high > high[1] and rsiAtSwingHigh < rsiAtSwingHigh[1] and rsiOverbought
// 4. مرشح الاتجاه (EMA 200)
marketTrend = ta.ema(close, 200)
isUptrend = close > marketTrend
// 5. الإشارات النهائية
buySignal = bullishDiv and macdBullish and isUptrend
sellSignal = bearishDiv and macdBearish and not isUptrend
// 6. العرض على الرسم
plotshape(buySignal, title="شراء", text="▲", style=shape.labelup, location=location.belowbar, color=color.new(#00FF00, 0), textcolor=color.white)
plotshape(sellSignal, title="بيع", text="▼", style=shape.labeldown, location=location.abovebar, color=color.new(#FF0000, 0), textcolor=color.white)
// 7. تنبيهات
alertcondition(buySignal, "إشارة شراء", "Bullish Divergence + MACD Crossover")
alertcondition(sellSignal, "إشارة بيع", "Bearish Divergence + MACD Crossunder")
Open-source script
In true TradingView spirit, the creator of this script has made it open-source, so that traders can review and verify its functionality. Kudos to the author! While you can use it for free, remember that republishing the code is subject to our House Rules.
Disclaimer
The information and publications are not meant to be, and do not constitute, financial, investment, trading, or other types of advice or recommendations supplied or endorsed by TradingView. Read more in the Terms of Use.