OPEN-SOURCE SCRIPT
Peak & Valley Screener Radar
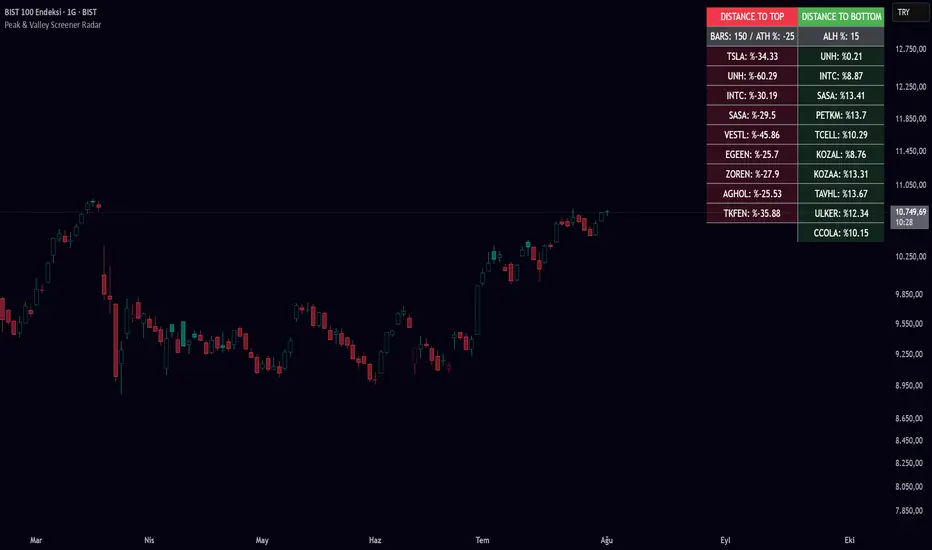
This Pine Script indicator is designed to help traders and investors analyze the percentage distance of stock prices from their recent All-Time High (ATH) and All-Time Low (ALH) over a user-defined number of bars.
It functions as a multi-stock screener, scanning a customizable list of stocks (default: 40 BIST 500 stocks) and displaying results in a dynamic table on the chart.
The script identifies stocks that have pulled back more than a specified percentage from their ATH (potential buying opportunities) or risen less than a specified percentage from their ALH (potential caution zones).
Key Features:
Customizable Stock List: Users can input a comma-separated list of stock tickers (e.g., "AAPL,GOOGL,MSFT") to scan any symbols available on TradingView.
User-Defined Parameters: Adjust the lookback period (bars back, default 250), ATH pullback threshold (default 10%), and ALH rise threshold (default 10%).
Dynamic Table Display: Results are shown in a table with two columns: "Distance to TOP" (ATH pullbacks in red) and "Distance to BOTTOM" (ALH rises in green). The table includes input parameters for quick reference and can be positioned anywhere on the chart (top/bottom left/center/right).
Optional Plots: Toggle plots to visualize the percentage distances for the current chart symbol (red for ATH, green for ALH).
Efficient Data Handling: Uses request.security with tuples for optimized multi-symbol data fetching, supporting up to ~80 stocks without exceeding Pine Script limits (adjust table rows if needed for more).
Real-Time Updates: The table updates only on the last bar for performance efficiency.
How It Works:
The script calculates the highest high and lowest low over the specified bars for each stock.
It computes the percentage difference from the current close: negative for ATH (pullback) and positive for ALH (rise).
Stocks meeting the thresholds are listed in the table with their exact percentages.
Usage Tips:
Apply this indicator to any chart (e.g., a BIST index or stock) to run the screener in the background.
Ideal for swing traders scanning for undervalued stocks near ATH or overbought near ALH.
Note: Performance may vary with large stock lists due to TradingView's security call limits (~40-50 calls per script). Test with smaller lists if needed.
You can bypass the 40-stock limit by adding the indicator twice to the chart, entering 40 different stocks in the second indicator and setting a different table position from the first one, allowing you to scan 80 stocks simultaneously. In fact, this way, you can scan as many stocks as your plan's limits allow.
This script is released under the Mozilla Public License 2.0. Feedback and suggestions are welcome, but please adhere to TradingView's House Rules—no guarantees of profitability, use at your own risk.Disclaimer: This is not financial advice. Past performance does not predict future results. Always conduct your own research.
Open-source script
In true TradingView spirit, the creator of this script has made it open-source, so that traders can review and verify its functionality. Kudos to the author! While you can use it for free, remember that republishing the code is subject to our House Rules.
Disclaimer
The information and publications are not meant to be, and do not constitute, financial, investment, trading, or other types of advice or recommendations supplied or endorsed by TradingView. Read more in the Terms of Use.