OPEN-SOURCE SCRIPT
Palfrey Ltd: CBT Navigator Legacy
🧭 How to Use the CBT Navigator Legacy Indicator
The CBT Navigator Legacy is designed to assist long-term Bitcoin holders with structured exit planning across the capital cycle. It overlays key price zones and ROI thresholds to help you manage conviction, de-risk responsibly, and navigate euphoric conditions with clarity.
🔹 Setup & Inputs
Average Entry: Input the average USD price at which you acquired your BTC position.
Cycle Peak Estimate: Set a hypothetical top for the current market cycle (e.g. $250,000).
Funding Rate Proxy: Enter a manually observed or estimated annualized funding rate (e.g. 0.12 for 12%).
🔹 What It Displays
The indicator renders horizontal lines at:
Sell Zone 1 (72% of peak): Early de-risking for disciplined capital preservation.
Sell Zone 2 (90% of peak): Start reducing core positions.
Sell Zone 3 (100% of peak): Near peak euphoria—high-risk environment.
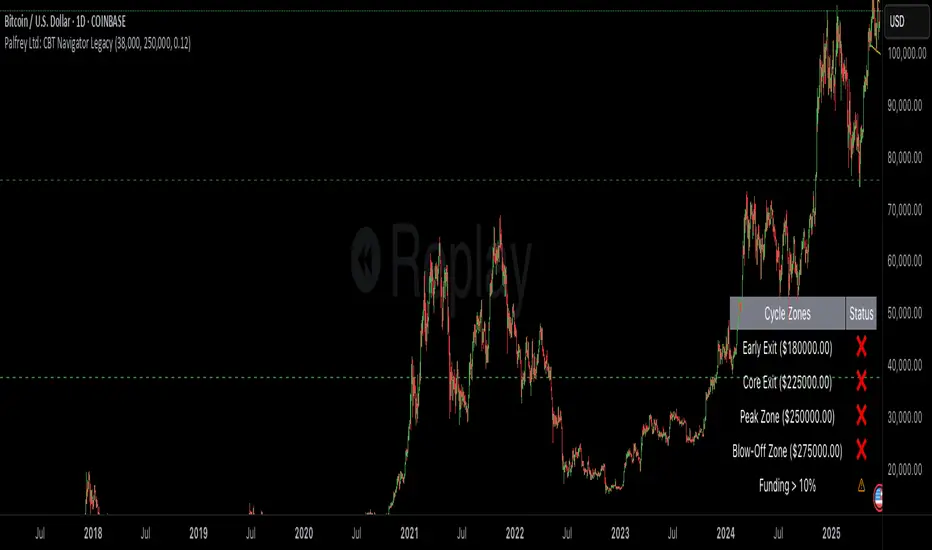
Sell Zone Max (110% of peak): Blow-off top zone—exit remaining speculative exposure.
ROI Multiples (2x to 10x): Visualize profit multiples based on your entry price.
A small dashboard on-screen summarizes which zones price has entered and whether funding rates are elevated (above 10%).
🔹 How to Use It
Strategic Planning: Use the tool to define your sell zones before the market gets volatile.
Psychological Anchor: The visual zones provide a reference point when sentiment becomes irrational.
Non-Overfitting: It works without relying on live market data proxies or on-chain feeds—ideal for legacy views.
For deeper insights into how this framework fits into broader cycle structure, macro analysis, and risk models, refer to the articles at
📬 coinandcapital.substack.com
The CBT Navigator Legacy is designed to assist long-term Bitcoin holders with structured exit planning across the capital cycle. It overlays key price zones and ROI thresholds to help you manage conviction, de-risk responsibly, and navigate euphoric conditions with clarity.
🔹 Setup & Inputs
Average Entry: Input the average USD price at which you acquired your BTC position.
Cycle Peak Estimate: Set a hypothetical top for the current market cycle (e.g. $250,000).
Funding Rate Proxy: Enter a manually observed or estimated annualized funding rate (e.g. 0.12 for 12%).
🔹 What It Displays
The indicator renders horizontal lines at:
Sell Zone 1 (72% of peak): Early de-risking for disciplined capital preservation.
Sell Zone 2 (90% of peak): Start reducing core positions.
Sell Zone 3 (100% of peak): Near peak euphoria—high-risk environment.
Sell Zone Max (110% of peak): Blow-off top zone—exit remaining speculative exposure.
ROI Multiples (2x to 10x): Visualize profit multiples based on your entry price.
A small dashboard on-screen summarizes which zones price has entered and whether funding rates are elevated (above 10%).
🔹 How to Use It
Strategic Planning: Use the tool to define your sell zones before the market gets volatile.
Psychological Anchor: The visual zones provide a reference point when sentiment becomes irrational.
Non-Overfitting: It works without relying on live market data proxies or on-chain feeds—ideal for legacy views.
For deeper insights into how this framework fits into broader cycle structure, macro analysis, and risk models, refer to the articles at
📬 coinandcapital.substack.com
Open-source script
In true TradingView spirit, the creator of this script has made it open-source, so that traders can review and verify its functionality. Kudos to the author! While you can use it for free, remember that republishing the code is subject to our House Rules.
Disclaimer
The information and publications are not meant to be, and do not constitute, financial, investment, trading, or other types of advice or recommendations supplied or endorsed by TradingView. Read more in the Terms of Use.