OPEN-SOURCE SCRIPT
Awesome Oscillator and MACD Histogram by SierraPilot (Lemrin)
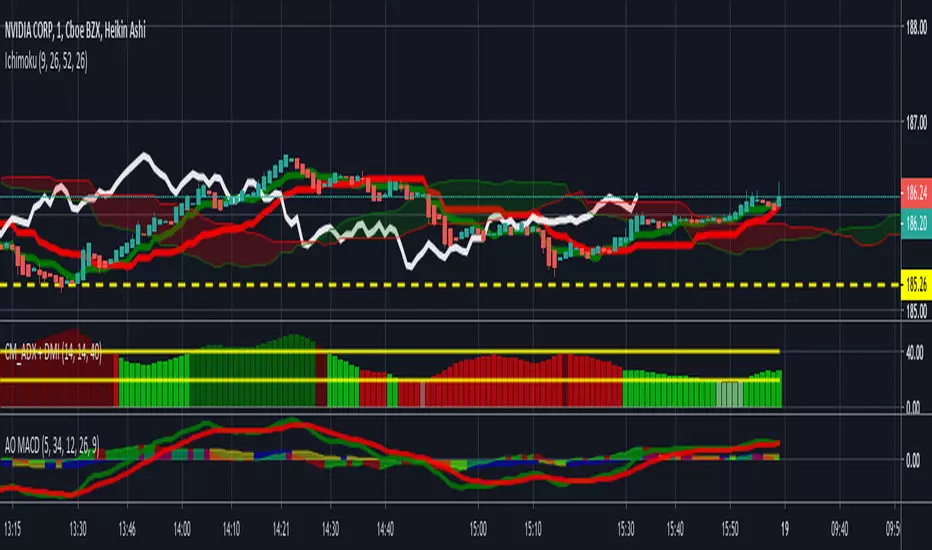
This is an indicator I stole from Lemrin. I added the plots for the MACD line and the Signal line and also changed the AO and MACD histo to an area plot. MACD = red and green. AO = blue and yellow. Green over top of Blue = possible reversal. Green overlaid over blue = uptrend. Yellow over top of Red = downside reversal possible. Yellow overlaid over Red = downtrend in progress. MACD and Signal line behave normally. Thanks to Lemrin for the majority of the code.
Open-source script
In true TradingView spirit, the creator of this script has made it open-source, so that traders can review and verify its functionality. Kudos to the author! While you can use it for free, remember that republishing the code is subject to our House Rules.
Disclaimer
The information and publications are not meant to be, and do not constitute, financial, investment, trading, or other types of advice or recommendations supplied or endorsed by TradingView. Read more in the Terms of Use.