OPEN-SOURCE SCRIPT
Heikin Ashi of Candle RSI
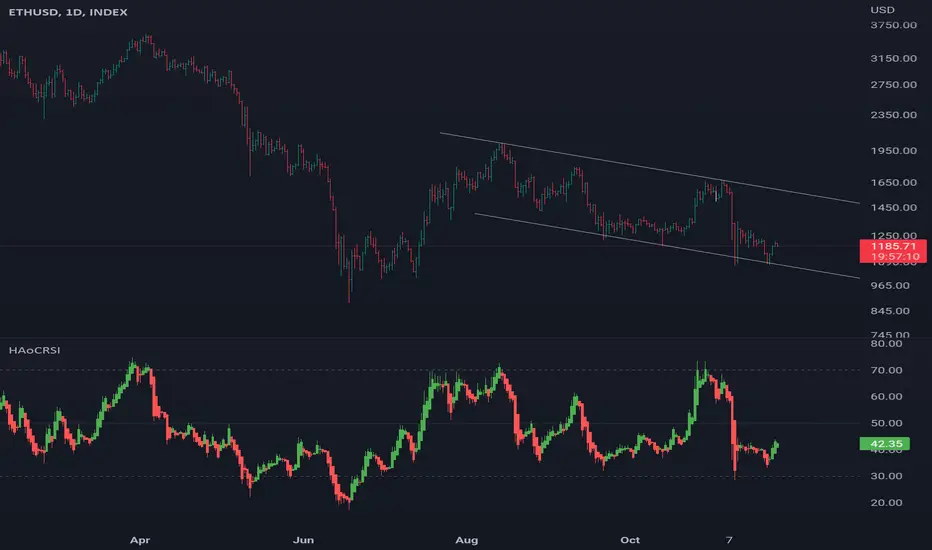
This is indicator plot Heikin Ashi of chart with RSI data
You can use this indicator like normal RSI with divergence or cross overbought oversold level
It can help you find pivot better and have better visual of market conditions when market overbought or oversold
You can use this indicator like normal RSI with divergence or cross overbought oversold level
It can help you find pivot better and have better visual of market conditions when market overbought or oversold
Open-source script
In true TradingView spirit, the creator of this script has made it open-source, so that traders can review and verify its functionality. Kudos to the author! While you can use it for free, remember that republishing the code is subject to our House Rules.
Disclaimer
The information and publications are not meant to be, and do not constitute, financial, investment, trading, or other types of advice or recommendations supplied or endorsed by TradingView. Read more in the Terms of Use.