OPEN-SOURCE SCRIPT
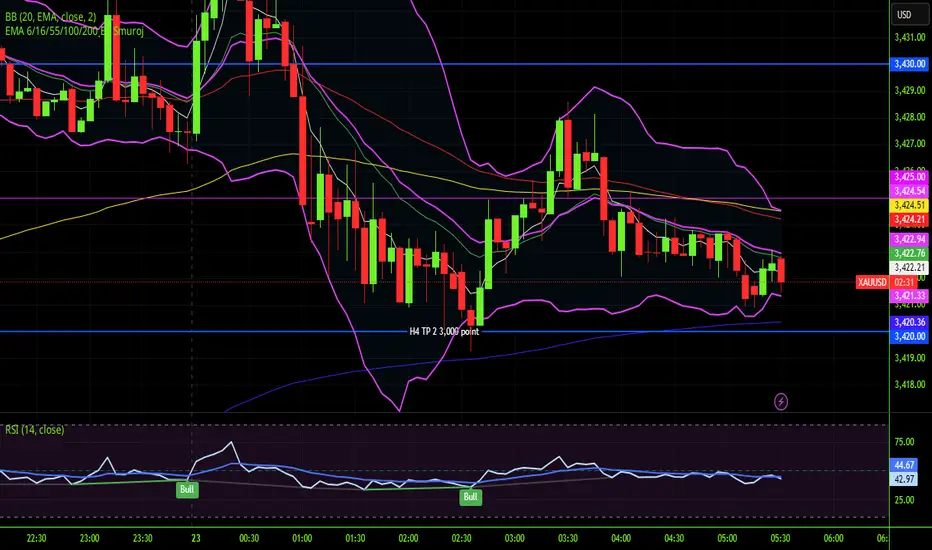
EMA 6/16/55/100/200 ฺBy Smuroj
คำอธิบายเป็นภาษาไทย
ชุด EMA นี้ประกอบด้วยเส้นค่าเฉลี่ยเคลื่อนที่แบบเอ็กซ์โปเนนเชียล (EMA) ระยะเวลาต่าง ๆ ซึ่งถูกนำมาใช้เพื่อวิเคราะห์แนวโน้มราคาในระยะต่าง ๆ ดังนี้:
EMA 6 และ 16: ใช้สำหรับดูแนวโน้มระยะสั้นและการเปลี่ยนแปลงราคาที่รวดเร็ว
EMA 55: เป็นแนวโน้มระยะกลาง
EMA 100 และ 200: เป็นแนวโน้มระยะยาว ซึ่งช่วยดูภาพรวมของแนวโน้มตลาดในระดับลึก
การใช้งานในการเทรด:
ถ้าราคาอยู่เหนือ EMA ระยะต่าง ๆ แสดงถึงแนวโน้มขาขึ้น
ถ้าราคาอยู่ต่ำกว่า EMA ระยะต่าง ๆ แสดงถึงแนวโน้มขาลง
การตัดกันของ EMA สั้นและยาว เช่น EMA 6 ตัด EMA 16 ขึ้นบน อาจเป็นสัญญาณซื้อ
การตัดกันในทางตรงกันข้าม อาจเป็นสัญญาณขาย
การใช้หลายเส้นช่วยยืนยันแนวโน้มและลดความผิดพลาดในการตัดสินใจ
English Explanation
This EMA set consists of various Exponential Moving Average lines over different periods, which are used to analyze price trends across various timeframes:
EMA 6 and 16: For short-term trend analysis and quick price changes.
EMA 55: Represents a medium-term trend.
EMA 100 and 200: Indicate long-term trends, helping to view the overall market direction.
How to use in trading:
When price is above these EMA lines, it suggests an uptrend.
When price is below these EMA lines, it indicates a downtrend.
Crossovers between short and longer EMAs (e.g., EMA 6 crossing above EMA 16) can signal buy opportunities.
Conversely, crossovers downward can signal sell opportunities.
Using multiple EMA lines helps confirm the trend and reduce false signals.
Open-source script
In true TradingView spirit, the creator of this script has made it open-source, so that traders can review and verify its functionality. Kudos to the author! While you can use it for free, remember that republishing the code is subject to our House Rules.
Disclaimer
The information and publications are not meant to be, and do not constitute, financial, investment, trading, or other types of advice or recommendations supplied or endorsed by TradingView. Read more in the Terms of Use.