OPEN-SOURCE SCRIPT
Volatility-Volume Index (VVI)
Volatility-Volume Index (VVI) – Indicator Description
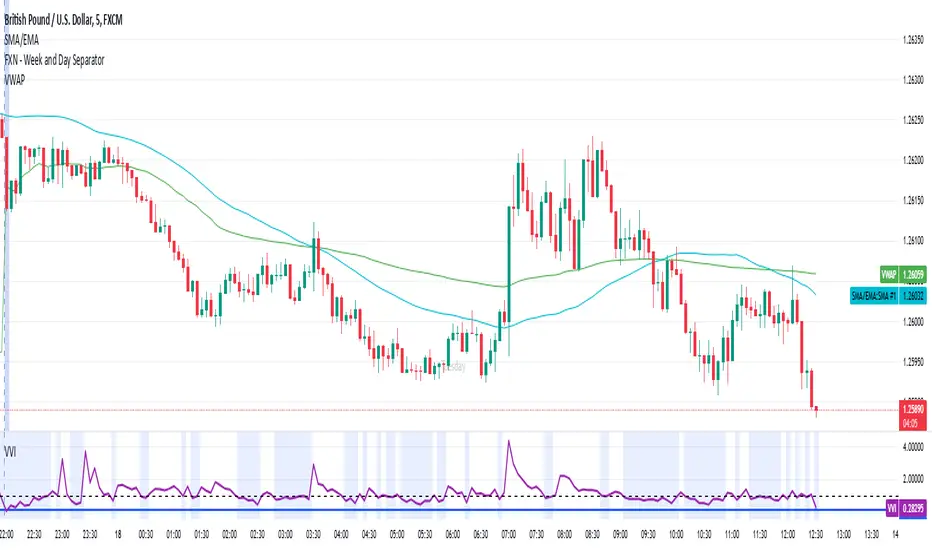
The Volatility-Volume Index (VVI) is a custom trading indicator designed to identify market consolidation and anticipate breakouts by combining volatility (ATR) and trading volume into a single metric.
How It Works
Measures Volatility: Uses a 14-period Average True Range (ATR) to gauge price movement intensity.
Tracks Volume: Monitors trading activity to identify accumulation or distribution phases.
Normalization: ATR and volume are normalized using their respective 20-period Simple Moving Averages (SMA) for a balanced comparison.
Interpretation
VVI < 1: Low volatility and volume → Consolidation phase (range-bound market).
VVI > 1: Increased volatility and/or volume → Potential breakout or trend continuation.
How to Use VVI
Detect Consolidation:
Look for extended periods where VVI remains below 1.
Confirm with sideways price movement in a narrow range.
Anticipate Breakouts:
A spike above 1 signals a possible trend shift or breakout.
Why Use VVI?
Unlike traditional volatility indicators (ATR, Bollinger Bands) or volume-based tools (VWAP), VVI combines both elements to provide a clearer picture of consolidation zones and breakout potential.
Open-source script
In true TradingView spirit, the creator of this script has made it open-source, so that traders can review and verify its functionality. Kudos to the author! While you can use it for free, remember that republishing the code is subject to our House Rules.
Disclaimer
The information and publications are not meant to be, and do not constitute, financial, investment, trading, or other types of advice or recommendations supplied or endorsed by TradingView. Read more in the Terms of Use.