OPEN-SOURCE SCRIPT
Real-Time Price Line by Candle Color
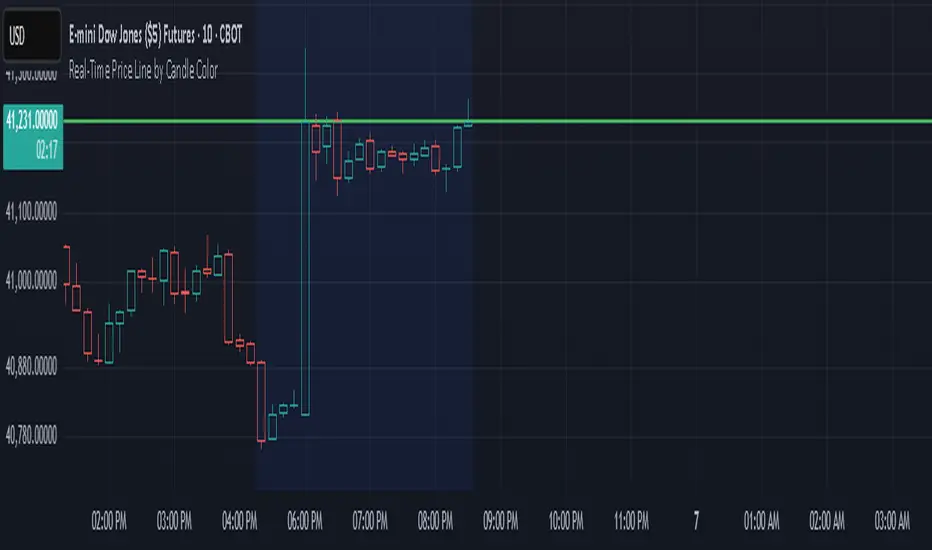
This indicator draws a horizontal line at the current price that updates in real time on each candle. The line:
Extends infinitely left and right
Changes color based on the current candle:
🟢 Green if the candle is bullish (close ≥ open)
🔴 Red if the candle is bearish (close < open)
Automatically clears and redraws each bar to reflect the latest price and direction
Use this as a simple but effective visual aid to track the live price and its directional bias.
Open-source script
In true TradingView spirit, the creator of this script has made it open-source, so that traders can review and verify its functionality. Kudos to the author! While you can use it for free, remember that republishing the code is subject to our House Rules.
Disclaimer
The information and publications are not meant to be, and do not constitute, financial, investment, trading, or other types of advice or recommendations supplied or endorsed by TradingView. Read more in the Terms of Use.