PINE LIBRARY
Correlation HeatMap Matrix Data [TradingFinder]
🔵Introduction
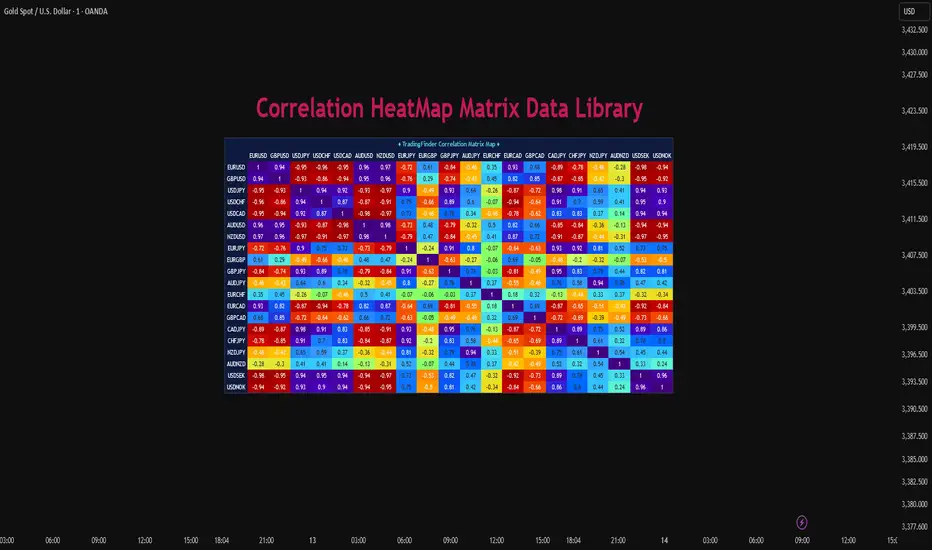
Correlation is a statistical measure that shows the degree and direction of a linear relationship between two assets.
Its value ranges from -1 to +1: +1 means perfect positive correlation, 0 means no linear relationship, and -1 means perfect negative correlation.
In financial markets, correlation is used for portfolio diversification, risk management, pairs trading, intermarket analysis, and identifying divergences.
Correlation HeatMap Matrix Data TradingFinder is a Pine Script v6 library that calculates and returns raw correlation matrix data between up to 20 symbols. It only provides the data – it does not draw or render the heatmap – making it ideal for use in other scripts that handle visualization or further analysis. The library uses ta.correlation for fast and accurate calculations.

It also includes two helper functions for visual styling:
Pine Script®
🔵How to use
Correlation is a statistical measure that shows the degree and direction of a linear relationship between two assets.
Its value ranges from -1 to +1: +1 means perfect positive correlation, 0 means no linear relationship, and -1 means perfect negative correlation.
In financial markets, correlation is used for portfolio diversification, risk management, pairs trading, intermarket analysis, and identifying divergences.
Correlation HeatMap Matrix Data TradingFinder is a Pine Script v6 library that calculates and returns raw correlation matrix data between up to 20 symbols. It only provides the data – it does not draw or render the heatmap – making it ideal for use in other scripts that handle visualization or further analysis. The library uses ta.correlation for fast and accurate calculations.
It also includes two helper functions for visual styling:
- CorrelationColor(corr): takes the correlation value as input and generates a smooth gradient color, ranging from strong negative to strong positive correlation.
- CorrelationTextColor(corr): takes the correlation value as input and returns a text color that ensures optimal contrast over the background color.
Library
"Correlation_HeatMap_Matrix_Data_TradingFinder"
CorrelationColor(corr)
Parameters:
corr (float)
CorrelationTextColor(corr)
Parameters:
corr (float)
Data_Matrix(Corr_Period, Sym_1, Sym_2, Sym_3, Sym_4, Sym_5, Sym_6, Sym_7, Sym_8, Sym_9, Sym_10, Sym_11, Sym_12, Sym_13, Sym_14, Sym_15, Sym_16, Sym_17, Sym_18, Sym_19, Sym_20)
Parameters:
Corr_Period (int)
Sym_1 (string)
Sym_2 (string)
Sym_3 (string)
Sym_4 (string)
Sym_5 (string)
Sym_6 (string)
Sym_7 (string)
Sym_8 (string)
Sym_9 (string)
Sym_10 (string)
Sym_11 (string)
Sym_12 (string)
Sym_13 (string)
Sym_14 (string)
Sym_15 (string)
Sym_16 (string)
Sym_17 (string)
Sym_18 (string)
Sym_19 (string)
Sym_20 (string)
🔵How to use
- Import the library into your Pine Script using the import keyword and its full namespace.
- Decide how many symbols you want to include in your correlation matrix (up to 20). Each symbol must be provided as a string, for example

 EURUSD .
 - Choose the correlation period (Corr\_Period) in bars. This is the lookback window used for the calculation, such as 20, 50, or 100 bars.
- Call Data_Matrix(Corr_Period, Sym_1, ..., Sym_20) with your selected parameters. The function will return an array containing the correlation values for every symbol pair (upper triangle of the matrix plus diagonal).
For example:Pine Script® var string Sym_1 = '' , var string Sym_2 = '' , var string Sym_3 = '' , var string Sym_4 = '' , var string Sym_5 = '' , var string Sym_6 = '' , var string Sym_7 = '' , var string Sym_8 = '' , var string Sym_9 = '' , var string Sym_10 = '' var string Sym_11 = '', var string Sym_12 = '', var string Sym_13 = '', var string Sym_14 = '', var string Sym_15 = '', var string Sym_16 = '', var string Sym_17 = '', var string Sym_18 = '', var string Sym_19 = '', var string Sym_20 = '' switch Market 'Forex' => Sym_1 := 'EURUSD' , Sym_2 := 'GBPUSD' , Sym_3 := 'USDJPY' , Sym_4 := 'USDCHF' , Sym_5 := 'USDCAD' , Sym_6 := 'AUDUSD' , Sym_7 := 'NZDUSD' , Sym_8 := 'EURJPY' , Sym_9 := 'EURGBP' , Sym_10 := 'GBPJPY' ,Sym_11 := 'AUDJPY', Sym_12 := 'EURCHF', Sym_13 := 'EURCAD', Sym_14 := 'GBPCAD', Sym_15 := 'CADJPY', Sym_16 := 'CHFJPY', Sym_17 := 'NZDJPY', Sym_18 := 'AUDNZD', Sym_19 := 'USDSEK' , Sym_20 := 'USDNOK' 'Stock' => Sym_1 := 'NVDA' , Sym_2 := 'AAPL' , Sym_3 := 'GOOGL' , Sym_4 := 'GOOG' , Sym_5 := 'META' , Sym_6 := 'MSFT' , Sym_7 := 'AMZN' , Sym_8 := 'AVGO' , Sym_9 := 'TSLA' , Sym_10 := 'BRK.B' ,Sym_11 := 'UNH' , Sym_12 := 'V' , Sym_13 := 'JPM' , Sym_14 := 'WMT' , Sym_15 := 'LLY' , Sym_16 := 'ORCL', Sym_17 := 'HD' , Sym_18 := 'JNJ' , Sym_19 := 'MA' , Sym_20 := 'COST' 'Crypto' => Sym_1 := 'BTCUSD' , Sym_2 := 'ETHUSD' , Sym_3 := 'BNBUSD' , Sym_4 := 'XRPUSD' , Sym_5 := 'SOLUSD' , Sym_6 := 'ADAUSD' , Sym_7 := 'DOGEUSD' , Sym_8 := 'AVAXUSD' , Sym_9 := 'DOTUSD' , Sym_10 := 'TRXUSD' ,Sym_11 := 'LTCUSD' , Sym_12 := 'LINKUSD', Sym_13 := 'UNIUSD', Sym_14 := 'ATOMUSD', Sym_15 := 'ICPUSD', Sym_16 := 'ARBUSD', Sym_17 := 'APTUSD', Sym_18 := 'FILUSD', Sym_19 := 'OPUSD' , Sym_20 := 'USDT.D' 'Custom' => Sym_1 := Sym_1_C , Sym_2 := Sym_2_C , Sym_3 := Sym_3_C , Sym_4 := Sym_4_C , Sym_5 := Sym_5_C , Sym_6 := Sym_6_C , Sym_7 := Sym_7_C , Sym_8 := Sym_8_C , Sym_9 := Sym_9_C , Sym_10 := Sym_10_C ,Sym_11 := Sym_11_C, Sym_12 := Sym_12_C, Sym_13 := Sym_13_C, Sym_14 := Sym_14_C, Sym_15 := Sym_15_C, Sym_16 := Sym_16_C, Sym_17 := Sym_17_C, Sym_18 := Sym_18_C, Sym_19 := Sym_19_C , Sym_20 := Sym_20_C [SYM_1_1 ,SYM_1_2 ,SYM_1_3 ,SYM_1_4 ,SYM_1_5 ,SYM_1_6 ,SYM_1_7 ,SYM_1_8 ,SYM_1_9 ,SYM_1_10,SYM_1_11,SYM_1_12,SYM_1_13,SYM_1_14,SYM_1_15,SYM_1_16,SYM_1_17,SYM_1_18,SYM_1_19,SYM_1_20, SYM_2_2 , SYM_2_3 , SYM_2_4 , SYM_2_5 , SYM_2_6 , SYM_2_7 , SYM_2_8 , SYM_2_9 , SYM_2_10, SYM_2_11, SYM_2_12, SYM_2_13, SYM_2_14, SYM_2_15, SYM_2_16, SYM_2_17, SYM_2_18, SYM_2_19, SYM_2_20, SYM_3_3 , SYM_3_4 , SYM_3_5 , SYM_3_6 , SYM_3_7 , SYM_3_8 , SYM_3_9 , SYM_3_10, SYM_3_11, SYM_3_12, SYM_3_13, SYM_3_14, SYM_3_15, SYM_3_16, SYM_3_17, SYM_3_18, SYM_3_19, SYM_3_20, SYM_4_4 , SYM_4_5 , SYM_4_6 , SYM_4_7 , SYM_4_8 , SYM_4_9 , SYM_4_10, SYM_4_11, SYM_4_12, SYM_4_13, SYM_4_14, SYM_4_15, SYM_4_16, SYM_4_17, SYM_4_18, SYM_4_19, SYM_4_20, SYM_5_5 , SYM_5_6 , SYM_5_7 , SYM_5_8 , SYM_5_9 , SYM_5_10, SYM_5_11, SYM_5_12, SYM_5_13, SYM_5_14, SYM_5_15, SYM_5_16, SYM_5_17, SYM_5_18, SYM_5_19, SYM_5_20, SYM_6_6 , SYM_6_7 , SYM_6_8 , SYM_6_9 , SYM_6_10, SYM_6_11, SYM_6_12, SYM_6_13, SYM_6_14, SYM_6_15, SYM_6_16, SYM_6_17, SYM_6_18, SYM_6_19, SYM_6_20, SYM_7_7 , SYM_7_8 , SYM_7_9 , SYM_7_10, SYM_7_11, SYM_7_12, SYM_7_13, SYM_7_14, SYM_7_15, SYM_7_16, SYM_7_17, SYM_7_18, SYM_7_19, SYM_7_20, SYM_8_8 , SYM_8_9 , SYM_8_10, SYM_8_11, SYM_8_12, SYM_8_13, SYM_8_14, SYM_8_15, SYM_8_16, SYM_8_17, SYM_8_18, SYM_8_19, SYM_8_20, SYM_9_9 , SYM_9_10, SYM_9_11, SYM_9_12, SYM_9_13, SYM_9_14, SYM_9_15, SYM_9_16, SYM_9_17, SYM_9_18,SYM_9_19, SYM_9_20, SYM_10_10, SYM_10_11, SYM_10_12, SYM_10_13, SYM_10_14, SYM_10_15, SYM_10_16, SYM_10_17, SYM_10_18, SYM_10_19, SYM_10_20, SYM_11_11, SYM_11_12, SYM_11_13, SYM_11_14, SYM_11_15, SYM_11_16, SYM_11_17, SYM_11_18, SYM_11_19, SYM_11_20, SYM_12_12, SYM_12_13, SYM_12_14, SYM_12_15, SYM_12_16, SYM_12_17, SYM_12_18, SYM_12_19, SYM_12_20, SYM_13_13, SYM_13_14, SYM_13_15, SYM_13_16, SYM_13_17, SYM_13_18, SYM_13_19, SYM_13_20, SYM_14_14, SYM_14_15, SYM_14_16, SYM_14_17, SYM_14_18, SYM_14_19, SYM_14_20, SYM_15_15, SYM_15_16, SYM_15_17, SYM_15_18, SYM_15_19, SYM_15_20, SYM_16_16, SYM_16_17, SYM_16_18, SYM_16_19, SYM_16_20, SYM_17_17, SYM_17_18, SYM_17_19, SYM_17_20, SYM_18_18, SYM_18_19, SYM_18_20, SYM_19_19, SYM_19_20, SYM_20_20] = Corr.Data_Matrix(Corr_period, Sym_1 ,Sym_2 ,Sym_3 ,Sym_4 ,Sym_5 ,Sym_6 ,Sym_7 ,Sym_8 ,Sym_9 ,Sym_10,Sym_11,Sym_12,Sym_13,Sym_14,Sym_15,Sym_16,Sym_17,Sym_18,Sym_19,Sym_20) - Loop through or index into this array to retrieve each correlation value for your custom layout or logic.
- Pass each correlation value to CorrelationColor() to get the corresponding gradient background color, which reflects the correlation’s strength and direction (negative to positive).
For example:Pine Script® Corr.CorrelationColor(SYM_3_10) - Pass the same correlation value to CorrelationTextColor() to get the correct text color for readability against that background.
For example:Pine Script® Corr.CorrelationTextColor(SYM_1_1) - Use these colors in a table or label to render your own heatmap or any other visualization you need.
Pine library
In true TradingView spirit, the author has published this Pine code as an open-source library so that other Pine programmers from our community can reuse it. Cheers to the author! You may use this library privately or in other open-source publications, but reuse of this code in publications is governed by House Rules.
💎Get instant (Demo/Vip) access here: tradingFinder.com/
✅Get access to our support team: t.me/TFLABS
🧠Free Forex, Crypto & Stock Trading tutorial, same as ICT, Smart Money & Price Action:
tradingfinder.com/education/forex/
✅Get access to our support team: t.me/TFLABS
🧠Free Forex, Crypto & Stock Trading tutorial, same as ICT, Smart Money & Price Action:
tradingfinder.com/education/forex/
Disclaimer
The information and publications are not meant to be, and do not constitute, financial, investment, trading, or other types of advice or recommendations supplied or endorsed by TradingView. Read more in the Terms of Use.