OPEN-SOURCE SCRIPT
Updated Trend Oscillator
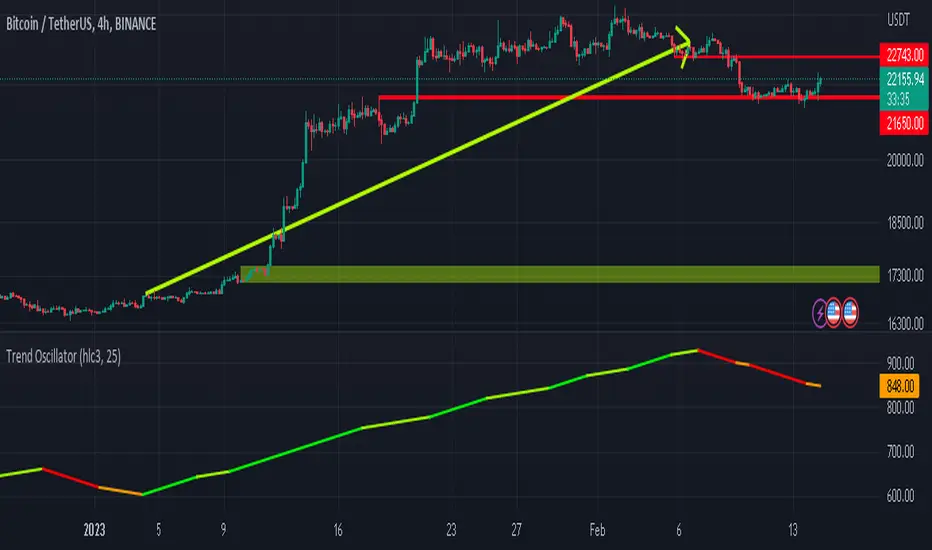
what is "Trend Oscillator"?
it is an indicator for determining the trend.
what it does?
analyzes the price action by reducing it to 4 different situations. Red means strong bear, orange means bearish, yellow means weak bull and green means strong bull. It was developed to help traders who trade in the direction of the trend and its biggest promise is to simplify price action.
how it does it?
He defines 4 different situations as follows. If the velocity of the price is positive and the acceleration is positive, it is a strong bull, if the velocity is positive and the acceleration is negative, it is a weak bull, if the velocity is negative and the acceleration is positive, it is a weak bear, if both velocity and acceleration are negative, it is a strong bear.
2 for strong bull
1 for the weak bull
-1 for weak bear
Creates a function that takes values of -2 for the strong bear. this function is the velocity of the principal indicator, and then the integral of this function forms the principal indicator.
how to use it?
"source" is used to change the source of the indicator,
"length" makes the indicator give a later but less signal.
you can use it to follow or analyze the trend. colors make it easy to use. learns about current or past trends by looking at colors. Like any trend indicator, it can give unsuccessful signals in a horizontal trend.
Release Notes
alert added.bg color options added. You can see it by turning on the visibility in the still settings section.
Open-source script
In true TradingView spirit, the creator of this script has made it open-source, so that traders can review and verify its functionality. Kudos to the author! While you can use it for free, remember that republishing the code is subject to our House Rules.
Disclaimer
The information and publications are not meant to be, and do not constitute, financial, investment, trading, or other types of advice or recommendations supplied or endorsed by TradingView. Read more in the Terms of Use.