OPEN-SOURCE SCRIPT
Indicators: Volume Zone Indicator & Price Zone Indicator
Volume Zone Indicator (VZO) and Price Zone Indicator (PZO) are by Waleed Aly Khalil.
Volume Zone Indicator (VZO)
------------------------------------------------------------
VZO is a leading volume oscillator that evaluates volume in relation to the direction of the net price change on each bar.
A value of 40 or above shows bullish accumulation. Low values (< 40) are bearish. Near zero or between +/- 20, the market is either in consolidation or near a break out. When VZO is near +/- 60, an end to the bull/bear run should be expected soon. If that run has been opposite to the long term price trend direction, then a reversal often will occur.
Traditional way of looking at this also works:
* +/- 40 levels are overbought / oversold
* +/- 60 levels are extreme overbought / oversold
More info:
drive.google.com/file/d/0Bx48Du_2aPFncEM3dHhyaWtTdjA/edit?usp=sharing
Price Zone Indicator (PZO)
------------------------------------------------------------
PZO is interpreted the same way as VZO (same formula with "close" substituted for "volume").
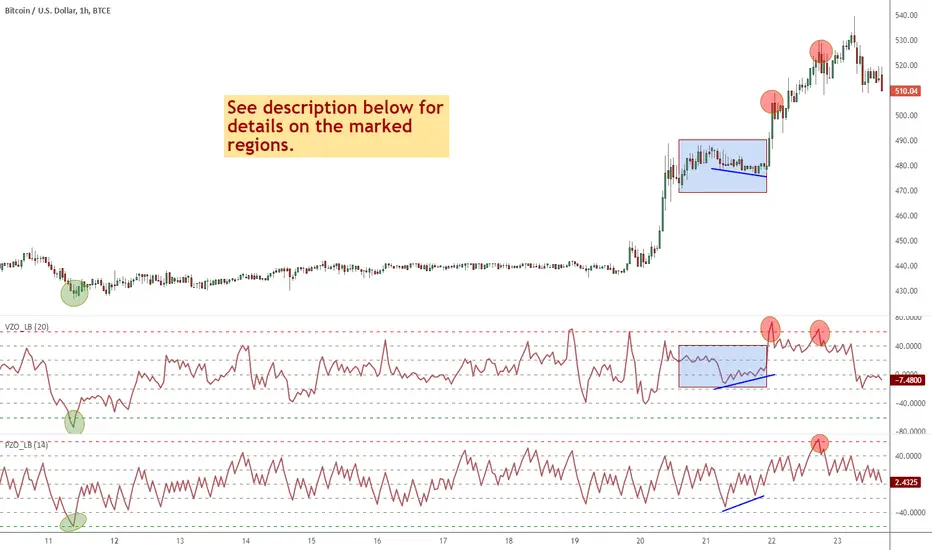
Chart Markings
------------------------------------------------------------
In the chart above,
* The red circles indicate a run-end (or reversal) zones (VZO +/- 60).
* Blue rectangle shows the consolidation zone (VZO betwen +/- 20)
I have been trying out VZO only for a week now, but I think this has lot of potential. Give it a try, let me know what you think.
Volume Zone Indicator (VZO)
------------------------------------------------------------
VZO is a leading volume oscillator that evaluates volume in relation to the direction of the net price change on each bar.
A value of 40 or above shows bullish accumulation. Low values (< 40) are bearish. Near zero or between +/- 20, the market is either in consolidation or near a break out. When VZO is near +/- 60, an end to the bull/bear run should be expected soon. If that run has been opposite to the long term price trend direction, then a reversal often will occur.
Traditional way of looking at this also works:
* +/- 40 levels are overbought / oversold
* +/- 60 levels are extreme overbought / oversold
More info:
drive.google.com/file/d/0Bx48Du_2aPFncEM3dHhyaWtTdjA/edit?usp=sharing
Price Zone Indicator (PZO)
------------------------------------------------------------
PZO is interpreted the same way as VZO (same formula with "close" substituted for "volume").
Chart Markings
------------------------------------------------------------
In the chart above,
* The red circles indicate a run-end (or reversal) zones (VZO +/- 60).
* Blue rectangle shows the consolidation zone (VZO betwen +/- 20)
I have been trying out VZO only for a week now, but I think this has lot of potential. Give it a try, let me know what you think.
Open-source script
In true TradingView spirit, the creator of this script has made it open-source, so that traders can review and verify its functionality. Kudos to the author! While you can use it for free, remember that republishing the code is subject to our House Rules.
List of my free indicators: bit.ly/1LQaPK8
List of my indicators at Appstore: blog.tradingview.com/?p=970
List of my indicators at Appstore: blog.tradingview.com/?p=970
Disclaimer
The information and publications are not meant to be, and do not constitute, financial, investment, trading, or other types of advice or recommendations supplied or endorsed by TradingView. Read more in the Terms of Use.