OPEN-SOURCE SCRIPT
Updated Blood Moons
Blood Moon Dates
Description:
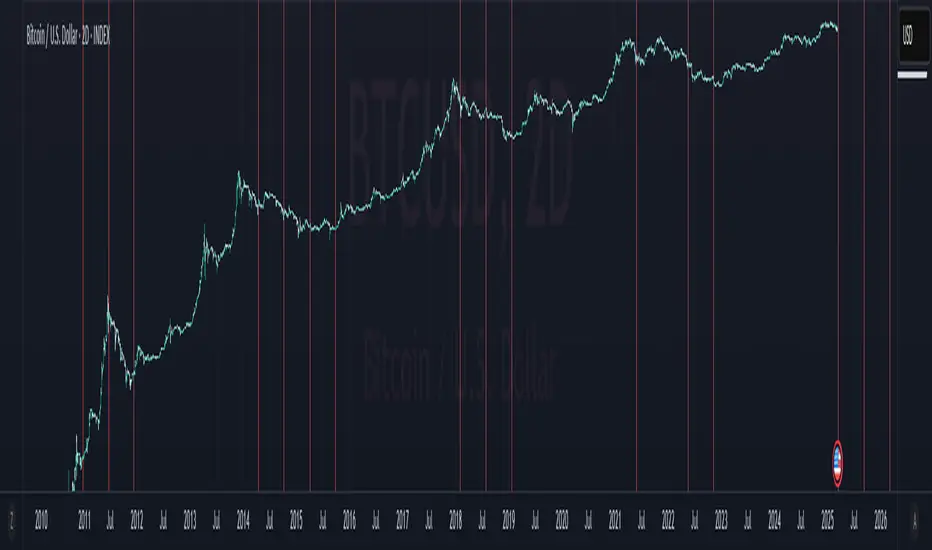
This indicator overlays vertical lines on your chart to mark the dates of total lunar eclipses (commonly known as "Blood Moons") from December 2010 to May 2040. Designed with cryptocurrency traders in mind, it’s perfect for analyzing potential correlations between these celestial events and price movements. The lines are drawn on the first bar and extend across the chart, making it easy to spot these dates on any timeframe.
Features:
Plots vertical lines for 19 Blood Moon events (2010–2040).
Customizable line color, style (solid, dotted, dashed), and width.
Option to toggle lines on/off for a cleaner chart.
Lines extend both ways for maximum visibility across your chart.
Settings:
Show Lines: Enable or disable the lines (default: enabled).
Line Color: Choose your preferred color (default: red).
Line Style: Select solid, dotted, or dashed (default: dotted).
Line Width: Adjust thickness from 1 to 5 (default: 2).
Usage:
Add this indicator to your chart to visualize Blood Moon dates alongside price action. Customize the appearance to suit your analysis style. Note: Lines are plotted based on timestamps and extend across the chart, so they’re best viewed on daily or higher timeframes for clarity.
Disclaimer:
This is an educational tool and not financial advice. Past performance does not guarantee future results. Use at your own risk.
Description:
This indicator overlays vertical lines on your chart to mark the dates of total lunar eclipses (commonly known as "Blood Moons") from December 2010 to May 2040. Designed with cryptocurrency traders in mind, it’s perfect for analyzing potential correlations between these celestial events and price movements. The lines are drawn on the first bar and extend across the chart, making it easy to spot these dates on any timeframe.
Features:
Plots vertical lines for 19 Blood Moon events (2010–2040).
Customizable line color, style (solid, dotted, dashed), and width.
Option to toggle lines on/off for a cleaner chart.
Lines extend both ways for maximum visibility across your chart.
Settings:
Show Lines: Enable or disable the lines (default: enabled).
Line Color: Choose your preferred color (default: red).
Line Style: Select solid, dotted, or dashed (default: dotted).
Line Width: Adjust thickness from 1 to 5 (default: 2).
Usage:
Add this indicator to your chart to visualize Blood Moon dates alongside price action. Customize the appearance to suit your analysis style. Note: Lines are plotted based on timestamps and extend across the chart, so they’re best viewed on daily or higher timeframes for clarity.
Disclaimer:
This is an educational tool and not financial advice. Past performance does not guarantee future results. Use at your own risk.
Release Notes
quality of life with auto scaling issueswould prefer vertical lines but pinescript is too picky with those
opting for shapes instead
Release Notes
script name fix from BM Balls to Blood MoonsRelease Notes
fixed bugwill have to check in a couple days whether that blood moon date prints a shape
Release Notes
updating default color/transpRelease Notes
reverting to near original, pinescript sucks btwRelease Notes
updated future datesOpen-source script
In true TradingView spirit, the creator of this script has made it open-source, so that traders can review and verify its functionality. Kudos to the author! While you can use it for free, remember that republishing the code is subject to our House Rules.
Disclaimer
The information and publications are not meant to be, and do not constitute, financial, investment, trading, or other types of advice or recommendations supplied or endorsed by TradingView. Read more in the Terms of Use.
Open-source script
In true TradingView spirit, the creator of this script has made it open-source, so that traders can review and verify its functionality. Kudos to the author! While you can use it for free, remember that republishing the code is subject to our House Rules.
Disclaimer
The information and publications are not meant to be, and do not constitute, financial, investment, trading, or other types of advice or recommendations supplied or endorsed by TradingView. Read more in the Terms of Use.