OPEN-SOURCE SCRIPT
Updated RSI chop filter
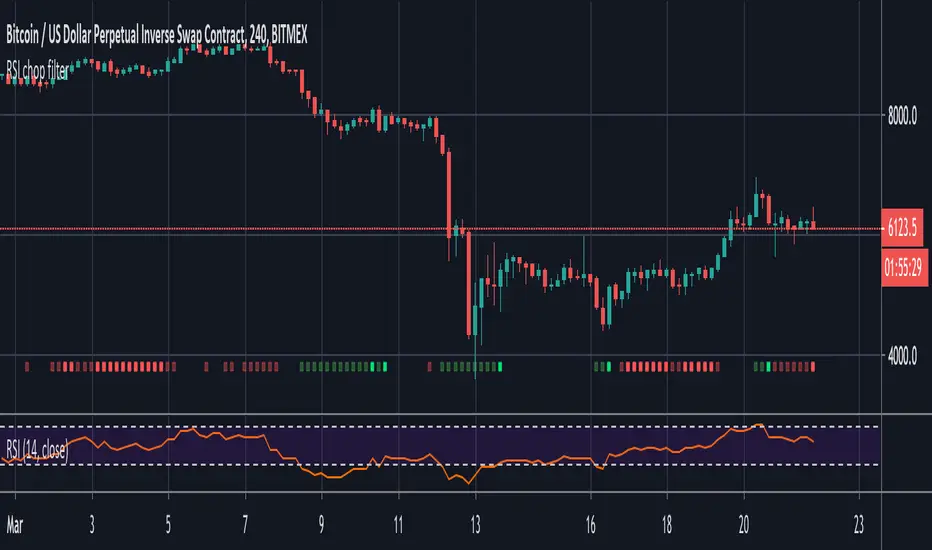
This demonstrates how you might filter your signals using RSI, but the same technique could be applied to Stochastic RSI and any other oscillator that has overbought and oversold conditions.
Use it as a visual indicator to determine when to enter a trade:
Red = Chop zone (no trade)
Bright red = Tight chop (dear god stay away)
Green = Overbought or oversold (signals permitted)
Bright green = Crossing up/down (take the trade)
To apply the filter, simply add 'and not chop' after your conditions as seen in the commented out example.
Release Notes
Swapping out a variable. A minor improvement.Open-source script
In true TradingView spirit, the creator of this script has made it open-source, so that traders can review and verify its functionality. Kudos to the author! While you can use it for free, remember that republishing the code is subject to our House Rules.
Disclaimer
The information and publications are not meant to be, and do not constitute, financial, investment, trading, or other types of advice or recommendations supplied or endorsed by TradingView. Read more in the Terms of Use.
Open-source script
In true TradingView spirit, the creator of this script has made it open-source, so that traders can review and verify its functionality. Kudos to the author! While you can use it for free, remember that republishing the code is subject to our House Rules.
Disclaimer
The information and publications are not meant to be, and do not constitute, financial, investment, trading, or other types of advice or recommendations supplied or endorsed by TradingView. Read more in the Terms of Use.