OPEN-SOURCE SCRIPT
Double Mcclellan Oscilator
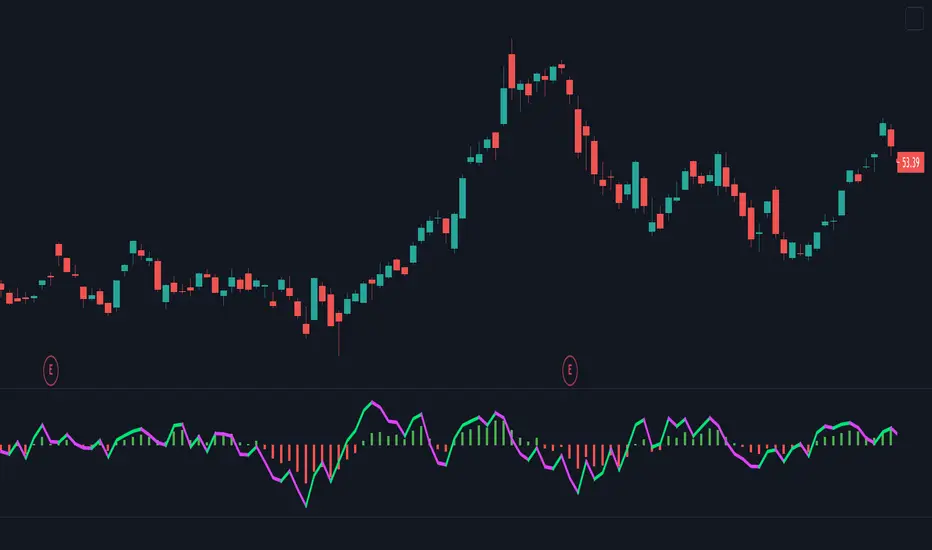
Plots two Mcclellan Oscillators.
First MCO is plotted as the histogram using traditional n values of 19 and 39. Histogram is green when the oscillator is greater than 0.
Second MCO is plotted as the lime green and pink line. N values for the second oscillator should be lower than the first so that it has a shorter window length.
Advance/decline can be calculated using NYSE or NASDAQ stocks.
Open-source script
In true TradingView spirit, the creator of this script has made it open-source, so that traders can review and verify its functionality. Kudos to the author! While you can use it for free, remember that republishing the code is subject to our House Rules.
Disclaimer
The information and publications are not meant to be, and do not constitute, financial, investment, trading, or other types of advice or recommendations supplied or endorsed by TradingView. Read more in the Terms of Use.