OPEN-SOURCE SCRIPT
Simple Volatility Cone
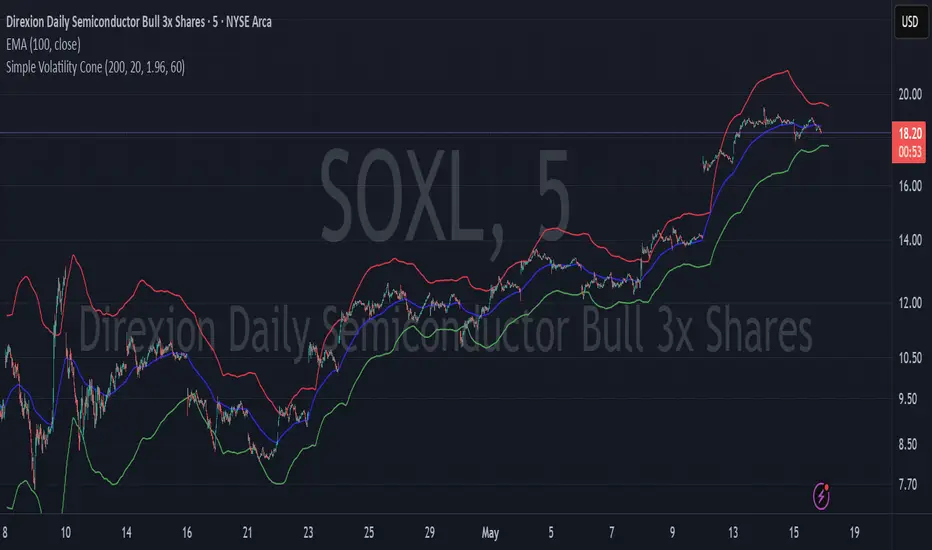
The Simple Volatility Cone indicator projects the potential future price range of a stock based on recent volatility. It calculates rolling standard deviation from log returns over a defined window, then uses a confidence interval to estimate the upper and lower bounds the price could reach over a future time horizon. These bounds are plotted directly on the chart, offset into the future, allowing traders to visualize expected price dispersion under a geometric Brownian motion assumption. This tool is useful for risk management, trade planning, and visualizing the potential impact of volatility.
Open-source script
In true TradingView spirit, the creator of this script has made it open-source, so that traders can review and verify its functionality. Kudos to the author! While you can use it for free, remember that republishing the code is subject to our House Rules.
Disclaimer
The information and publications are not meant to be, and do not constitute, financial, investment, trading, or other types of advice or recommendations supplied or endorsed by TradingView. Read more in the Terms of Use.