OPEN-SOURCE SCRIPT
Updated Fibonacci ReRSI Levels
Overview
The Fibonacci RSI Levels indicator plots key Fibonacci-based RSI levels directly on the price chart, offering a unique perspective on market momentum, potential reversal points, and support/resistance zones. By combining the Relative Strength Index (RSI) with Fibonacci retracement levels, this indicator helps traders identify overbought/oversold conditions, trend strength, and critical price levels for potential trading opportunities.
Key Features
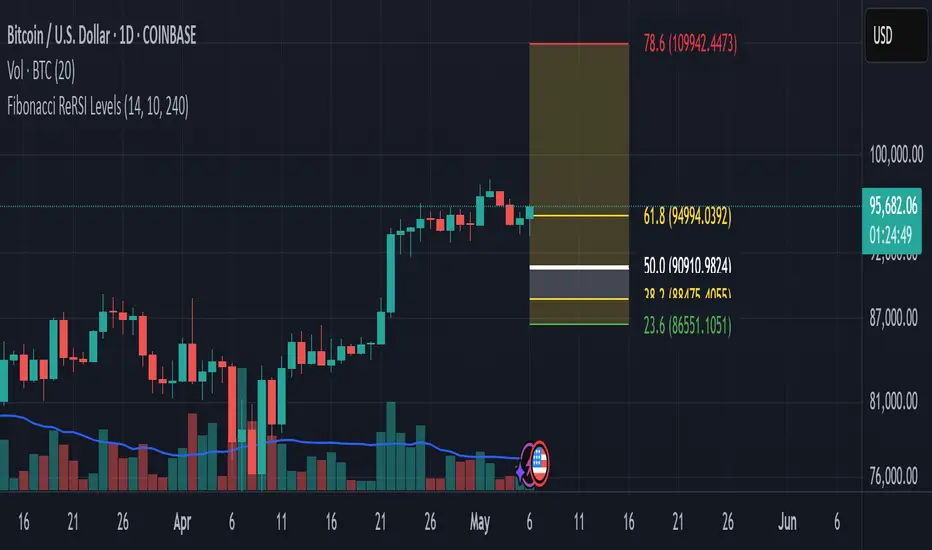
Fibonacci RSI Levels: Plots five key levels—23.6% (Oversold), 38.2% (Downtrend Limit), 50.0% (Mid Level), 61.8% (Uptrend Limit), and 78.6% (Overbought)—based on a logarithmic RSI calculation.
Customizable Settings: Adjust the RSI length, line extension, timeframe, and level colors to suit your trading style.
Gradient Fills: Optional gradient fills between levels provide a visual representation of the price's position relative to key zones.
Multi-Timeframe Support: Use the current chart resolution or specify a custom timeframe (e.g., 1M, 5D, 240 for 4 hours) for flexible analysis.
Logarithmic RSI Calculation: Ideal for assets with exponential price movements, such as cryptocurrencies.
How It Works
The indicator uses a reverse-engineered RSI calculation, inspired by Giorgos Siligardos' concept, to determine price levels corresponding to specific Fibonacci RSI values. These levels are plotted as horizontal lines on the chart, each with a label showing the Fibonacci percentage and the exact price level. If enabled, gradient fills between the levels change color based on the price's position, enhancing visual interpretation.
Usage
Support and Resistance: The 38.2% and 61.8% levels often act as support and resistance in trending markets.
Overbought/Oversold Conditions: The 23.6% and 78.6% levels can indicate potential reversal points due to oversold or overbought conditions.
Trend Confirmation: The 50% level serves as a neutral zone or pivot point. Prices above this level may indicate an uptrend, while prices below suggest a downtrend.
Gradient Fills: Use the gradient fills to quickly assess the price's position within the key zones, aiding in decision-making for entries, exits, or reversals.
Interpretation
Uptrend: When the price is above the 50% level and approaching the 61.8% level, it may signal a strong uptrend.
Downtrend: When the price is below the 50% level and nearing the 38.2% level, it may indicate a downtrend.
Reversal Zones: Watch for price reactions near the 23.6% and 78.6% levels, as these can be areas of potential reversals.
Customization
RSI Length: Adjust the RSI period to fine-tune the sensitivity of the levels.
Line Extension: Control how far the levels extend into the future for better visualization.
Timeframe: Choose between the current chart resolution or a custom timeframe for multi-timeframe analysis.
Colors: Customize the colors of each level and enable gradient fills for enhanced visual clarity.
The Fibonacci RSI Levels indicator plots key Fibonacci-based RSI levels directly on the price chart, offering a unique perspective on market momentum, potential reversal points, and support/resistance zones. By combining the Relative Strength Index (RSI) with Fibonacci retracement levels, this indicator helps traders identify overbought/oversold conditions, trend strength, and critical price levels for potential trading opportunities.
Key Features
Fibonacci RSI Levels: Plots five key levels—23.6% (Oversold), 38.2% (Downtrend Limit), 50.0% (Mid Level), 61.8% (Uptrend Limit), and 78.6% (Overbought)—based on a logarithmic RSI calculation.
Customizable Settings: Adjust the RSI length, line extension, timeframe, and level colors to suit your trading style.
Gradient Fills: Optional gradient fills between levels provide a visual representation of the price's position relative to key zones.
Multi-Timeframe Support: Use the current chart resolution or specify a custom timeframe (e.g., 1M, 5D, 240 for 4 hours) for flexible analysis.
Logarithmic RSI Calculation: Ideal for assets with exponential price movements, such as cryptocurrencies.
How It Works
The indicator uses a reverse-engineered RSI calculation, inspired by Giorgos Siligardos' concept, to determine price levels corresponding to specific Fibonacci RSI values. These levels are plotted as horizontal lines on the chart, each with a label showing the Fibonacci percentage and the exact price level. If enabled, gradient fills between the levels change color based on the price's position, enhancing visual interpretation.
Usage
Support and Resistance: The 38.2% and 61.8% levels often act as support and resistance in trending markets.
Overbought/Oversold Conditions: The 23.6% and 78.6% levels can indicate potential reversal points due to oversold or overbought conditions.
Trend Confirmation: The 50% level serves as a neutral zone or pivot point. Prices above this level may indicate an uptrend, while prices below suggest a downtrend.
Gradient Fills: Use the gradient fills to quickly assess the price's position within the key zones, aiding in decision-making for entries, exits, or reversals.
Interpretation
Uptrend: When the price is above the 50% level and approaching the 61.8% level, it may signal a strong uptrend.
Downtrend: When the price is below the 50% level and nearing the 38.2% level, it may indicate a downtrend.
Reversal Zones: Watch for price reactions near the 23.6% and 78.6% levels, as these can be areas of potential reversals.
Customization
RSI Length: Adjust the RSI period to fine-tune the sensitivity of the levels.
Line Extension: Control how far the levels extend into the future for better visualization.
Timeframe: Choose between the current chart resolution or a custom timeframe for multi-timeframe analysis.
Colors: Customize the colors of each level and enable gradient fills for enhanced visual clarity.
Release Notes
added CreditsOpen-source script
In true TradingView spirit, the creator of this script has made it open-source, so that traders can review and verify its functionality. Kudos to the author! While you can use it for free, remember that republishing the code is subject to our House Rules.
Disclaimer
The information and publications are not meant to be, and do not constitute, financial, investment, trading, or other types of advice or recommendations supplied or endorsed by TradingView. Read more in the Terms of Use.
Open-source script
In true TradingView spirit, the creator of this script has made it open-source, so that traders can review and verify its functionality. Kudos to the author! While you can use it for free, remember that republishing the code is subject to our House Rules.
Disclaimer
The information and publications are not meant to be, and do not constitute, financial, investment, trading, or other types of advice or recommendations supplied or endorsed by TradingView. Read more in the Terms of Use.