OPEN-SOURCE SCRIPT
Open Interest-RSI + Funding + Fractal Divergences
Indicator — “Open Interest-RSI + Funding + Fractal Divergences”
A multi-factor oscillator that fuses Open-Interest RSI, real-time Funding-Rate data and price/OI fractal divergences.
It paints BUY/SELL arrows in its own pane and directly on the price chart, helping you spot spots where crowd positioning, leverage costs and price action contradict each other.
1 Purpose
OI-RSI – measures conviction behind position changes instead of price momentum.
Funding Rate – shows who pays to hold positions (longs → bull bias, shorts → bear bias).
Fractal Divergences – detects HH/LL in price that are not confirmed by OI-RSI.
Optional Funding filter – hides signals when funding is already extreme.
Together these elements highlight exhaustion points and potential mean-reversion trades.
2 Inputs
RSI / Divergence
RSI length – default 14.
High-OI level / Low-OI level – default 70 / 30.
Fractal period n – default 2 (swing width).
Fractals to compare – how many past swings to scan, default 3.
Max visible arrows – keeps last 50 BUY/SELL arrows for speed.
Funding Rate
mode – choose FR, Avg Premium, Premium Index, Avg Prem + PI or FR-candle.
Visual scale (×) – multiplies raw funding to fit 0-100 oscillator scale (default 10).
specify symbol – enable only if funding symbol differs from chart.
use lower tf – averages 1-min premiums for smoother intraday view.
show table – tiny two-row widget at chart edge.
Signal Filter
Use Funding filter – ON hides long signals when funding > Buy-threshold and short signals when funding < Sell-threshold.
BUY threshold (%) – default 0.00 (raw %).
SELL threshold (%) – default 0.00 (raw %).
(Enter funding thresholds as raw percentages, e.g. 0.01 = +0.01 %).
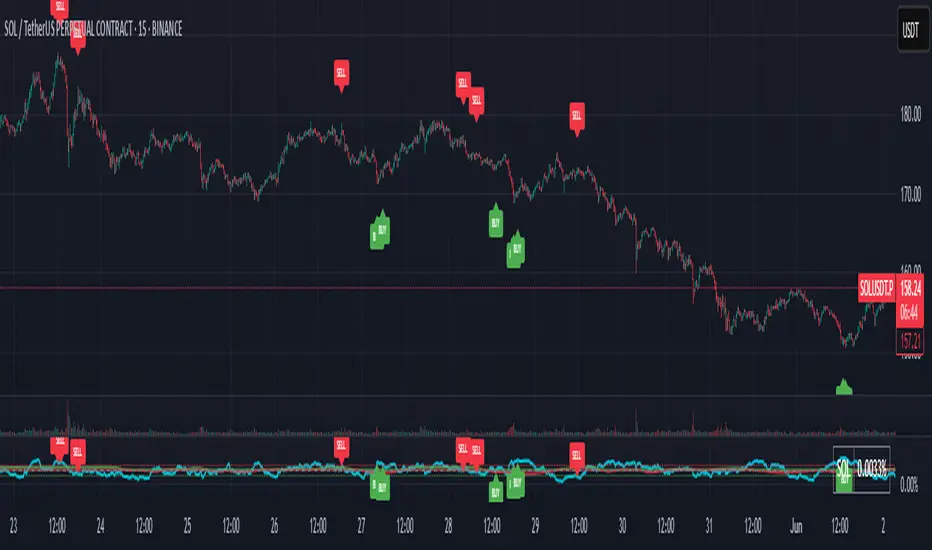
3 Visual Outputs
Sub-pane
Aqua OI-RSI curve with 70 / 50 / 30 reference lines.
Funding visualised according to selected mode (green above 0, red below 0, or other).
BUY / SELL arrows at oscillator extremes.
Price chart
Identical BUY / SELL arrows plotted with force_overlay = true above/below candles that formed qualifying fractals.
Optional table
Shows current asset ticker and latest funding value of the chosen mode.
4 Signal Logic (Summary)
Load _OI series and compute RSI.
Retrieve Funding-Rate + Premium Index (optionally from lower TF).
Find fractal swings (n bars left & right).
Check divergence:
Bearish – price HH + OI-RSI LH.
Bullish – price LL + OI-RSI HL.
If Funding-filter enabled, require funding < Buy-thr (long) or > Sell-thr (short).
Plot arrows and trigger two built-in alerts (Bearish OI-RSI divergence, Bullish OI-RSI divergence).
Signals are fixed once the fractal bar closes; they do not repaint afterwards.
5 How to Use
Attach to a liquid perpetual-futures chart (BTC, ETH, major Binance contracts).
If _OI or funding series is missing you’ll see an error.
Choose timeframe:
15 m – 4 h for intraday;
1 D+ for swing trades.
Lower TFs → more signals; raise Fractals to compare or use Funding filter to trim noise.
Trade checklist
Funding positive and rising → longs overcrowded.
Price makes higher high; OI-RSI makes lower high; Funding above Sell-threshold → consider short.
Reverse logic for longs.
Combine with trend filter (EMA ribbon, SuperTrend, etc.) so you fade only when price is stretched.
Automation – set TradingView alerts on the two alertconditions and send to webhooks/bots.
Performance tips
Keep Max visible arrows ≤ 50.
Disable lower-TF premium aggregation if script feels heavy.
6 Limitations
Some symbols lack _OI or funding history → script stops with a console message.
Binance Premium Index begins mid-2020; older dates show na.
Divergences confirm only after n bars (no forward repaint).
7 Changelog
v1.0 – 10 Jun 2025
Initial public release.
Added price-chart arrows via force_overlay.
A multi-factor oscillator that fuses Open-Interest RSI, real-time Funding-Rate data and price/OI fractal divergences.
It paints BUY/SELL arrows in its own pane and directly on the price chart, helping you spot spots where crowd positioning, leverage costs and price action contradict each other.
1 Purpose
OI-RSI – measures conviction behind position changes instead of price momentum.
Funding Rate – shows who pays to hold positions (longs → bull bias, shorts → bear bias).
Fractal Divergences – detects HH/LL in price that are not confirmed by OI-RSI.
Optional Funding filter – hides signals when funding is already extreme.
Together these elements highlight exhaustion points and potential mean-reversion trades.
2 Inputs
RSI / Divergence
RSI length – default 14.
High-OI level / Low-OI level – default 70 / 30.
Fractal period n – default 2 (swing width).
Fractals to compare – how many past swings to scan, default 3.
Max visible arrows – keeps last 50 BUY/SELL arrows for speed.
Funding Rate
mode – choose FR, Avg Premium, Premium Index, Avg Prem + PI or FR-candle.
Visual scale (×) – multiplies raw funding to fit 0-100 oscillator scale (default 10).
specify symbol – enable only if funding symbol differs from chart.
use lower tf – averages 1-min premiums for smoother intraday view.
show table – tiny two-row widget at chart edge.
Signal Filter
Use Funding filter – ON hides long signals when funding > Buy-threshold and short signals when funding < Sell-threshold.
BUY threshold (%) – default 0.00 (raw %).
SELL threshold (%) – default 0.00 (raw %).
(Enter funding thresholds as raw percentages, e.g. 0.01 = +0.01 %).
3 Visual Outputs
Sub-pane
Aqua OI-RSI curve with 70 / 50 / 30 reference lines.
Funding visualised according to selected mode (green above 0, red below 0, or other).
BUY / SELL arrows at oscillator extremes.
Price chart
Identical BUY / SELL arrows plotted with force_overlay = true above/below candles that formed qualifying fractals.
Optional table
Shows current asset ticker and latest funding value of the chosen mode.
4 Signal Logic (Summary)
Load _OI series and compute RSI.
Retrieve Funding-Rate + Premium Index (optionally from lower TF).
Find fractal swings (n bars left & right).
Check divergence:
Bearish – price HH + OI-RSI LH.
Bullish – price LL + OI-RSI HL.
If Funding-filter enabled, require funding < Buy-thr (long) or > Sell-thr (short).
Plot arrows and trigger two built-in alerts (Bearish OI-RSI divergence, Bullish OI-RSI divergence).
Signals are fixed once the fractal bar closes; they do not repaint afterwards.
5 How to Use
Attach to a liquid perpetual-futures chart (BTC, ETH, major Binance contracts).
If _OI or funding series is missing you’ll see an error.
Choose timeframe:
15 m – 4 h for intraday;
1 D+ for swing trades.
Lower TFs → more signals; raise Fractals to compare or use Funding filter to trim noise.
Trade checklist
Funding positive and rising → longs overcrowded.
Price makes higher high; OI-RSI makes lower high; Funding above Sell-threshold → consider short.
Reverse logic for longs.
Combine with trend filter (EMA ribbon, SuperTrend, etc.) so you fade only when price is stretched.
Automation – set TradingView alerts on the two alertconditions and send to webhooks/bots.
Performance tips
Keep Max visible arrows ≤ 50.
Disable lower-TF premium aggregation if script feels heavy.
6 Limitations
Some symbols lack _OI or funding history → script stops with a console message.
Binance Premium Index begins mid-2020; older dates show na.
Divergences confirm only after n bars (no forward repaint).
7 Changelog
v1.0 – 10 Jun 2025
Initial public release.
Added price-chart arrows via force_overlay.
Open-source script
In true TradingView spirit, the creator of this script has made it open-source, so that traders can review and verify its functionality. Kudos to the author! While you can use it for free, remember that republishing the code is subject to our House Rules.
Disclaimer
The information and publications are not meant to be, and do not constitute, financial, investment, trading, or other types of advice or recommendations supplied or endorsed by TradingView. Read more in the Terms of Use.