OPEN-SOURCE SCRIPT
Updated Visual RSI
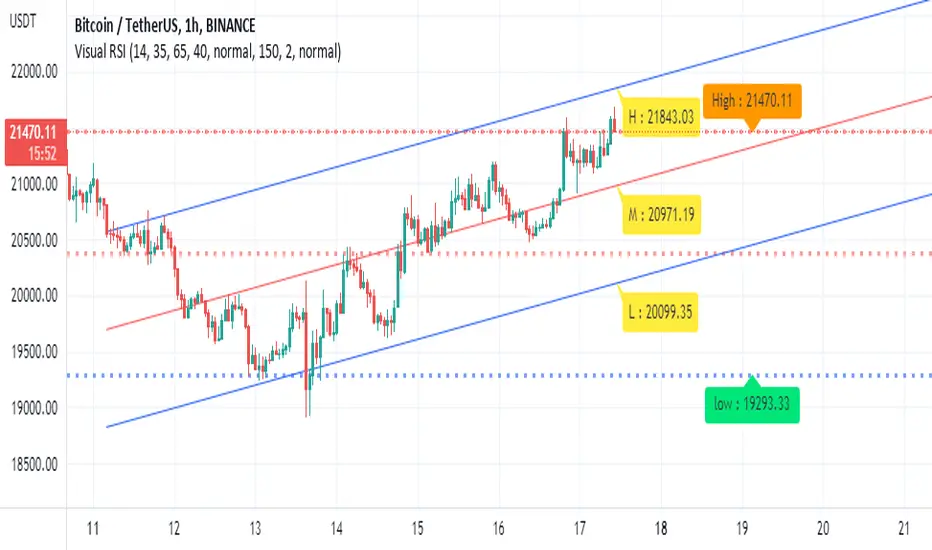
This is a visual format of regular RSI on the screen.
The indicator give you the RSI level for the high and lows and average as well. So it very easy to use it as you normally do with any RSI
buy point are when price reach bellow lower level and start breaking up. sell vice versa
it a concept idea to make our regular RSI more effective for the common user
I hope you like it
1 min chart

15min

The indicator give you the RSI level for the high and lows and average as well. So it very easy to use it as you normally do with any RSI
buy point are when price reach bellow lower level and start breaking up. sell vice versa
it a concept idea to make our regular RSI more effective for the common user
I hope you like it
1 min chart
15min
Release Notes
add linear regression to make analysis better Open-source script
In true TradingView spirit, the creator of this script has made it open-source, so that traders can review and verify its functionality. Kudos to the author! While you can use it for free, remember that republishing the code is subject to our House Rules.
Disclaimer
The information and publications are not meant to be, and do not constitute, financial, investment, trading, or other types of advice or recommendations supplied or endorsed by TradingView. Read more in the Terms of Use.
Open-source script
In true TradingView spirit, the creator of this script has made it open-source, so that traders can review and verify its functionality. Kudos to the author! While you can use it for free, remember that republishing the code is subject to our House Rules.
Disclaimer
The information and publications are not meant to be, and do not constitute, financial, investment, trading, or other types of advice or recommendations supplied or endorsed by TradingView. Read more in the Terms of Use.