OPEN-SOURCE SCRIPT
RSI or MFI %B
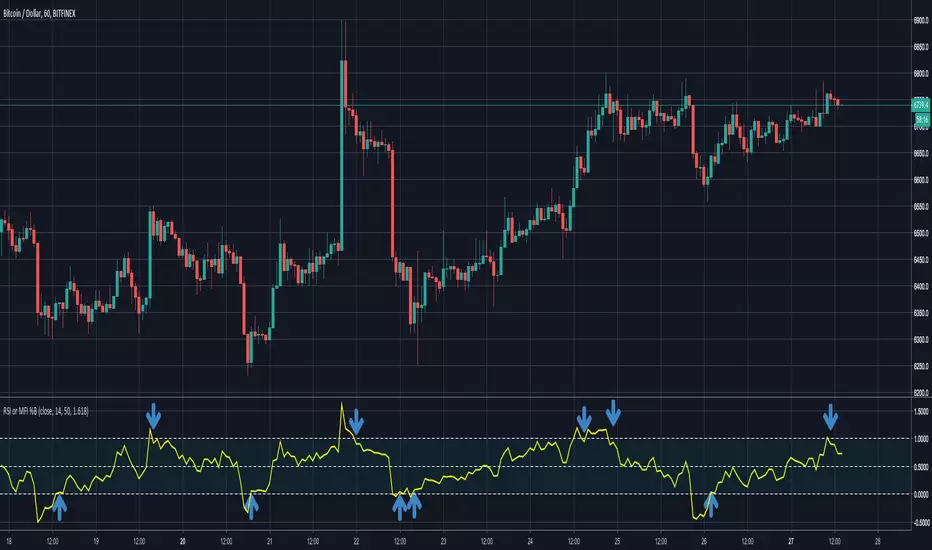
Plots where RSI or MFI is inside its Bollinger Bands. Various strategies: good to see the trend (above/below average), overbought/oversold conditions (you could work a strategy around RSI getting out of overbought/oversold conditions as shown in the screenshot), divergences, etc...
I will also publish a Bollinger Bands width of RSI to identify areas of squeeze in volatility
Enjoy!
I will also publish a Bollinger Bands width of RSI to identify areas of squeeze in volatility
Enjoy!
Open-source script
In true TradingView spirit, the creator of this script has made it open-source, so that traders can review and verify its functionality. Kudos to the author! While you can use it for free, remember that republishing the code is subject to our House Rules.
Disclaimer
The information and publications are not meant to be, and do not constitute, financial, investment, trading, or other types of advice or recommendations supplied or endorsed by TradingView. Read more in the Terms of Use.