OPEN-SOURCE SCRIPT
Updated HTF 3rd Weekly High/Low
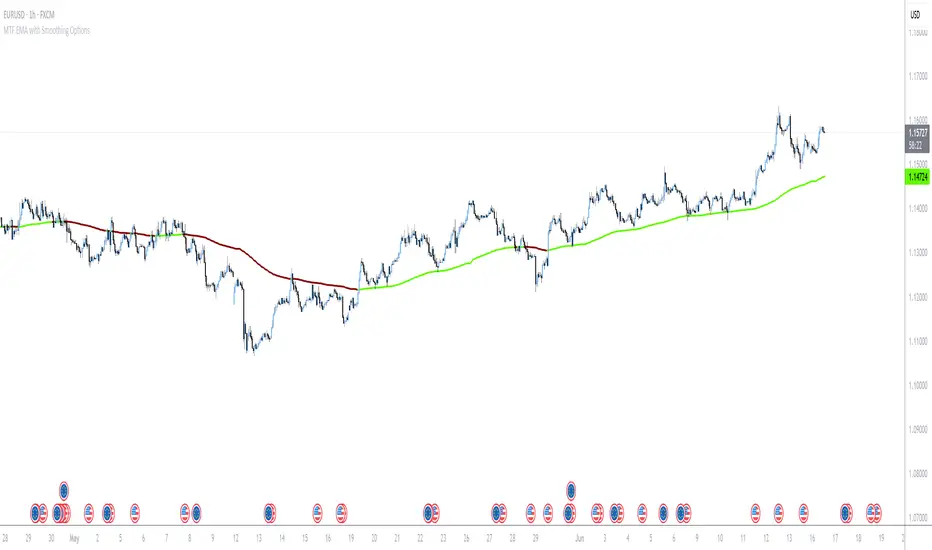
This indicator plots horizontal lines for the high and low of a selected past weekly candle, allowing traders to visualize higher time frame (HTF) structure on lower time frame charts (e.g., 1H, 4H, etc.).
Features:
Custom Weekly Range Selection: Use the dropdown to choose which weekly candle to reference — from the current week (0) to up to five weeks back.
Clean Horizontal Lines: High and low levels of the selected week are drawn as persistent horizontal lines.
Automatic Text Labels: Labels like Week-3H and Week-3L are shown on the right side of the chart, matching the week selected.
Customization:
Line colors
Line width and style (solid, dotted, dashed)
Text label offset
Automatic Refresh: Levels and labels are redrawn at the start of each new week to stay current with your selection.
Release Notes
Updated to suit clean chart.Open-source script
In true TradingView spirit, the creator of this script has made it open-source, so that traders can review and verify its functionality. Kudos to the author! While you can use it for free, remember that republishing the code is subject to our House Rules.
Disclaimer
The information and publications are not meant to be, and do not constitute, financial, investment, trading, or other types of advice or recommendations supplied or endorsed by TradingView. Read more in the Terms of Use.
Open-source script
In true TradingView spirit, the creator of this script has made it open-source, so that traders can review and verify its functionality. Kudos to the author! While you can use it for free, remember that republishing the code is subject to our House Rules.
Disclaimer
The information and publications are not meant to be, and do not constitute, financial, investment, trading, or other types of advice or recommendations supplied or endorsed by TradingView. Read more in the Terms of Use.