OPEN-SOURCE SCRIPT
Updated Price - Mean Reversion Expansion
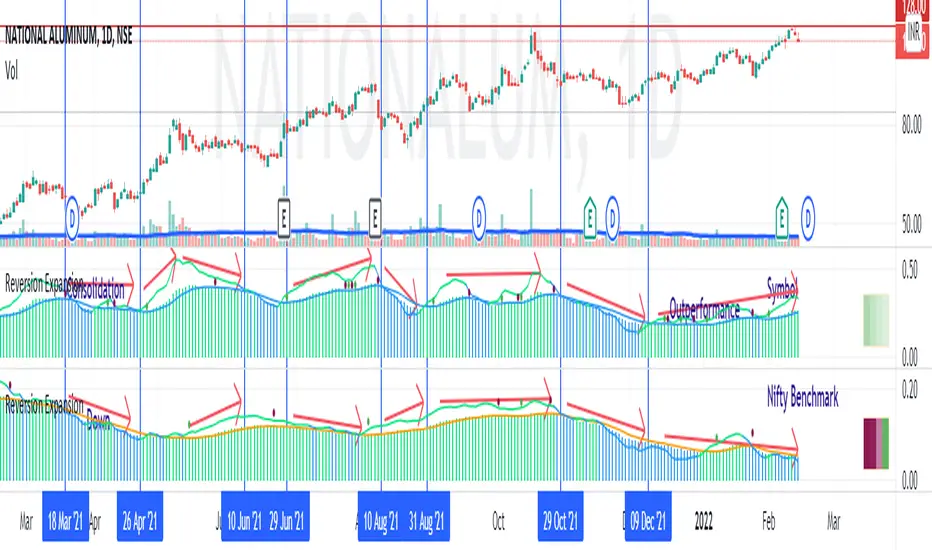
A simple indicator, to plot the quantitatively the reversion and expansion of price from a set of means.
A green bar plots prices above the set of means. A bar plots prices below the set of means. A blue bar plots price entangled in the means. The height of the bars denotes the far-ness from the set of means.
A blue envelope over the bars is the average of this reversion/expansion. A "crossover" of any bar (red/green) over this envelope is indicated by a "green dot" a "crossunder" of any bar (red/green) under this envelope is indicated by a "red dot".
The small trend strength table (when enabled) on the right side below show in a easy manner the data presented in the "Mean Angles" indicator. Refer to description there for more details.
Release Notes
- Added Price Delta, scaled price performance
Added an overlap of scaled price movement vis-a-vis the expansion and contraction. Clearly identifies the trend changes and objectively defines expansion and reversion.
Release Notes
- Option to select another symbol (benchmark) instead of the chart symbol
This option will help in measuring the reversion / expansion vis-a-vis broader benchmark when placed side-by-side. When the other symbol (benchmark is ticked, the envelope will be of orange color and not the usual blue color. This will help in quick identification.
Refer to
The lower plot is orange envelope, that of the benchmark. We can clearly observe regions where the symbol followed the benchmark, outperforms or lags the benchmark. This analysis can be done over multiple timeframes.
Release Notes
- Fixed other symbol EMA calculations when valid mean length of symbol starts later than benchmark
Release Notes
- Update Pine Script version 6
- Alert conditions and TrendLength additions - for Pine Screener
Open-source script
In true TradingView spirit, the creator of this script has made it open-source, so that traders can review and verify its functionality. Kudos to the author! While you can use it for free, remember that republishing the code is subject to our House Rules.
Disclaimer
The information and publications are not meant to be, and do not constitute, financial, investment, trading, or other types of advice or recommendations supplied or endorsed by TradingView. Read more in the Terms of Use.